471
National Fuel Market Analysis [FP20 Analytics Challenge-14]
National Fuel Market Analysis [FP20 Analytics Challenge-14]
Report Author: Ajay Singh
471
Share template with others
Report submitted for FP20 Analytics ZoomCharts Challenge 14 (March 2024). The report was built with the National Fuel Market Analysis dataset and includes ZoomCharts custom Drill Down PRO visuals for Power BI.
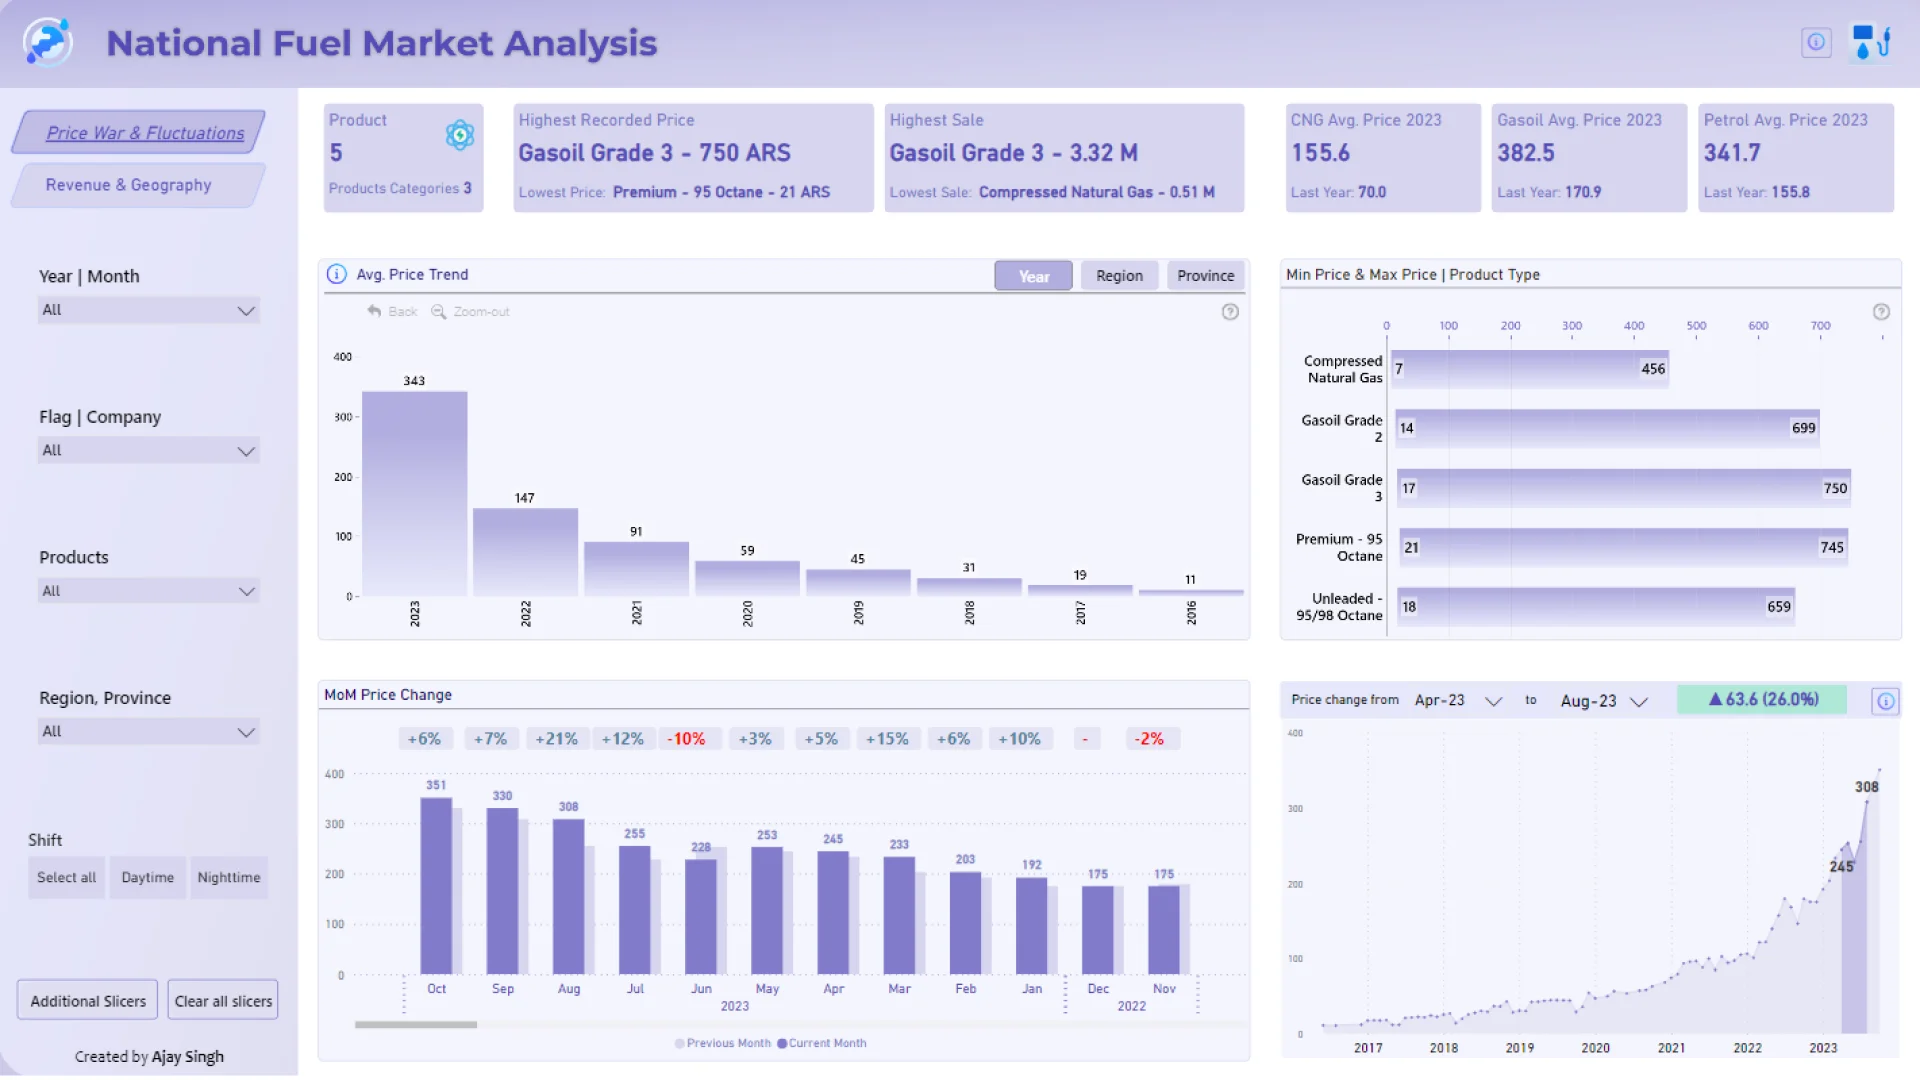
Author's description:🚀 Power BI project tackling the complexities of analyzing trends in the National Fuel Market! 📊
💡 Using Power BI's robust analytics capabilities, a comprehensive dashboard that delves deep into the Price fluctuations, patterns, Companies revenue & price variation in different regions & cities. From Petrol to Gasoil and CNG, this report breaks down the data to empower informed decision-making
📈 Key Highlights Include: Comparative analysis of fuel prices across regions. Historical trends showcasing price fluctuations over time Insightful deviation analysis pinpointing outliers and trends
4U Report Challenges
Participate in data challenges, build and submit reports to get free template downloads.
Join CommunityMobile view allows you to interact with the report. To Download the template please switch to desktop view.
Was this helpful? Thank you for your feedback!
Sorry about that.
How can we improve it?