logo
For Power BI Report Templates
  • Products

    Drill Down Visuals for Power BI

    Discover the most customizable custom visuals for Power BI.

    Pricing & licensing
    • Drill Down Donut Pro
      Drill Down Donut Category Composition
    • Drill Down Pie Pro
      Drill Down Pie Proportional Breakdown
    • Drill Down Combo Pro
      Drill Down Combo Multi-Metric Trends
    • Drill Down Combo Bar Pro
      Drill Down Combo Bar Cross-Metric Trends
    • Drill Down Line Pro
      Drill Down Line Trend Analysis
    • Drill Down Bubble Pro
      Drill Down Bubble Value Relationships
    • Drill Down Scatter Pro
      Drill Down Scatter Correlation Analysis
    • Drill Down Network Pro
      Drill Down Network Entity Connections
    • Drill Down Graph Pro
      Drill Down Graph Relationship Mapping
    • Drill Down Map Pro
      Drill Down Map Geographic Insights
    • Drill Down Waterfall Pro
      Drill Down Waterfall Change Breakdown
    • Drill Down Timeline Pro
      Drill Down Timeline Time-Based Metrics
    • Drill Down TimeSeries Pro
      Drill Down TimeSeries Temporal Patterns
    • Drill Down Line Pro
      Drill Down Line Trend Analysis

    Visuals in Planning

    Discover visuals we’re exploring, share your feedback, and help us decide what to build next.

    Browse concepts
  • Template Reports
    • Browse Report Templates
      Browse Report Templates Explore 2000+
      Power BI reports
    • Pricing Report Templates
      unlimited access

    Explore Report Templates

    Industry

    • Logistics
    • Education
    • Healthcare
    • Transportation
    • Banking
    • Ecommerce
    • Crime analytics
    • Retail
    • Manufacturing

    Business Domain

    • Sales
    • Marketing
    • Accounting & Finance
    • Human Resources
    • Research
    • Project Management
    • CRM
    • Support
    • Customer experience
  • Resources

      Learn

    • Video Tutorials Step-by-step Power BI guides
    • Webinars Live and recorded expert sessions
    • Visuals Gallery Explore all custom Power BI visuals
    • Blog Power BI tips, updates, and guides
    • Documentation Setup, features, and API reference

    Support

    • ZoomCharts Assistance Help from our product experts
    • Contact Sales Questions about pricing or licensing
    • Contact Support Technical help and troubleshooting
    • FAQ Quick answers to common questions
  • Services
    • Power BI Report Development
      Power BI Report Development End-to-end custom
      Power BI reports.
    • Custom Visual Development
      Custom Visual Development Custom visuals for
      your business needs.
  • Challenges
  • Pricing
Get started
Get started
Get it now
Go back

Contents

Dashboard and report examples NATIONAL FUEL MARKET ANALYSIS ARGENTINA (2016-2023)
Go back

798

NATIONAL FUEL MARKET ANALYSIS ARGENTINA (2016-2023)

NATIONAL FUEL MARKET ANALYSIS ARGENTINA (2016-2023)

Report
Report Interact

Report Author: Dereck Marin

798

Pie Map Donut Oil & Energy

Share template with others

Report submitted for FP20 Analytics ZoomCharts Challenge 14 (March 2024). The report was built with the National Fuel Market Analysis dataset and includes ZoomCharts custom Drill Down PRO visuals for Power BI. 

Author's description:
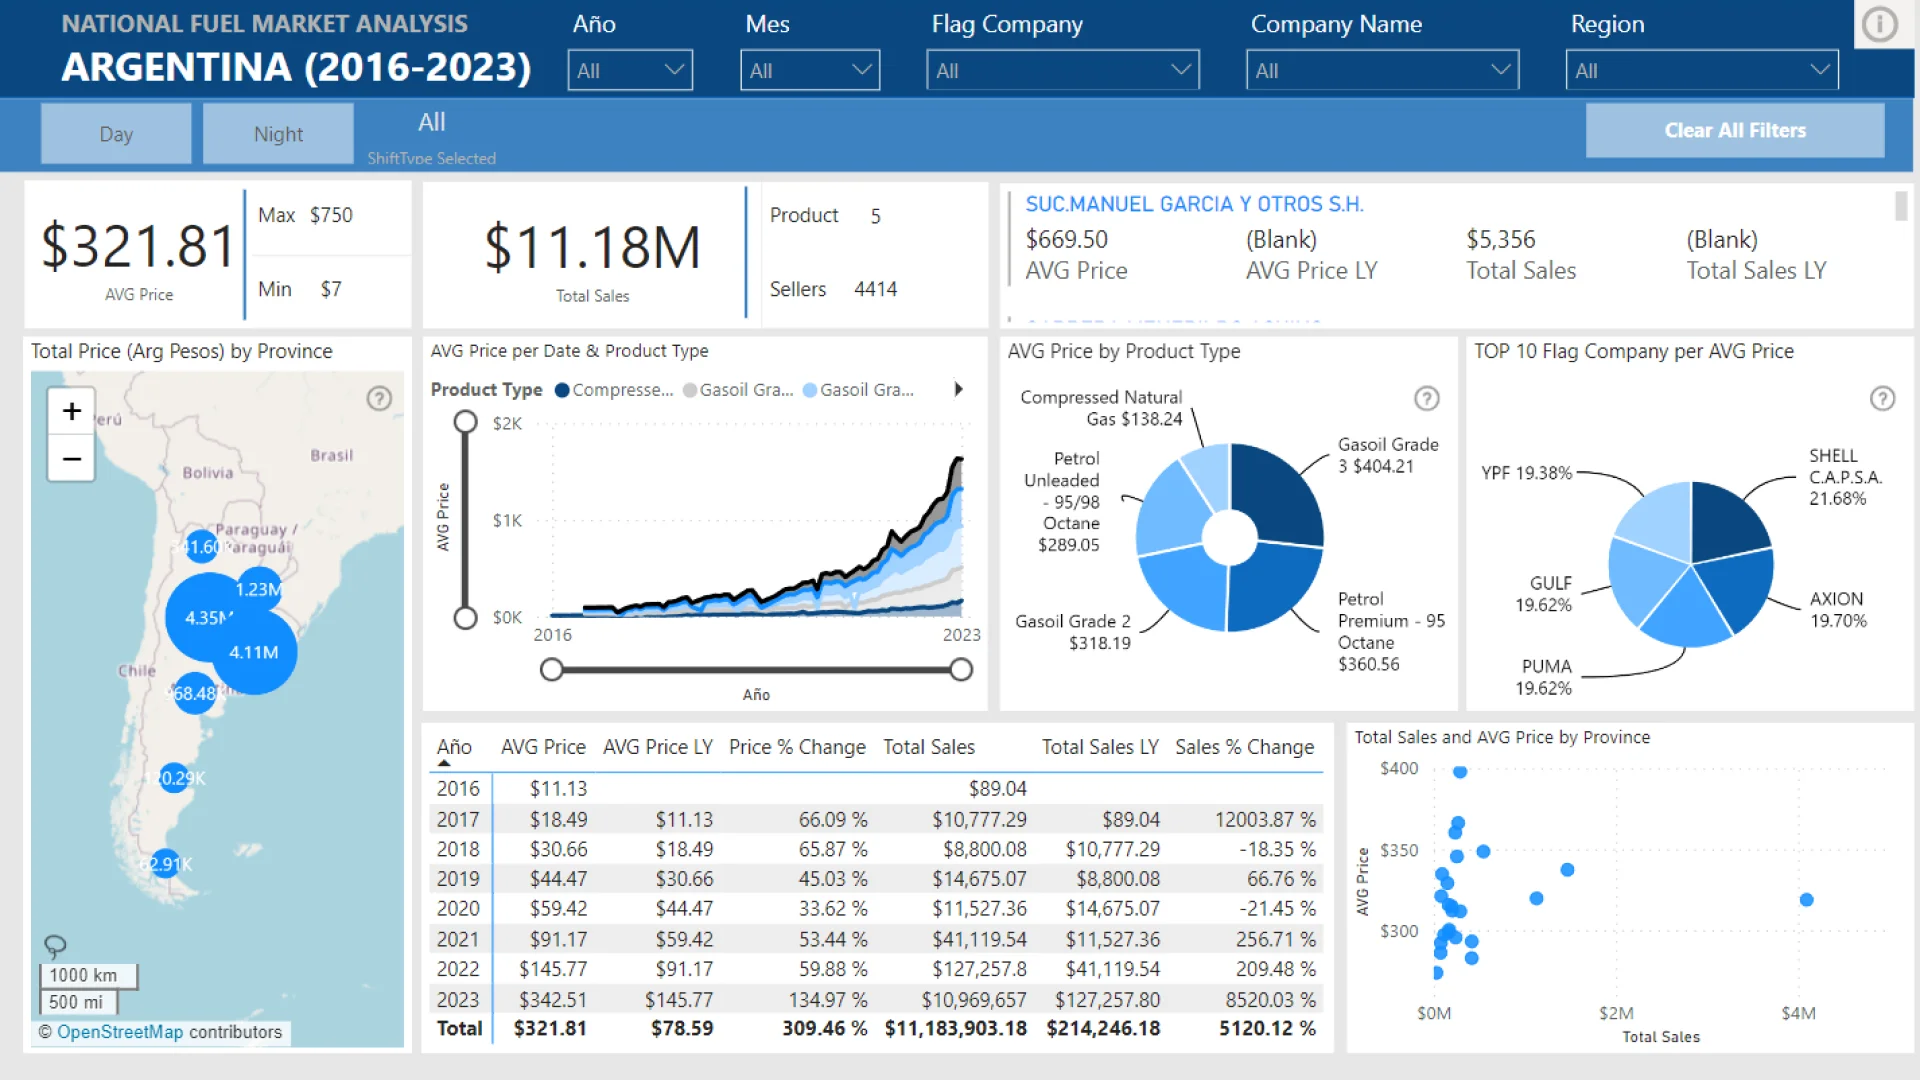
This project dives headfirst into Argentina's fuel market, analyzing trends and variations in fuel prices across different types and sellers from 2016 to 2023. Fueled by Power BI and Excel, this comprehensive report offers a clear and insightful picture of Argentina's fuel landscape.
Key Insights:
Volatility at the Pump: Brace yourselves! Average fuel prices have swung wildly, with lows as surprising as $7 and highs reaching a staggering $750.
Daylight Doesn't Guarantee Sales: Here's a shocker! Daytime sales in 2023 were virtually identical to nighttime sales, with a difference of just $2! Market Dominators: YPF reigns supreme with a commanding $4.39 million in sales, followed by Shell Capsa at $2.74 million and Axion at $1.66 million.
Beyond the Numbers: This analysis goes deeper than just figures. We'll explore the competitive landscape, identify the most popular fuels, and uncover fascinating sales trends, including some intriguing (but ultimately suppressed) findings from offshore Africa (more on that later!).

ZoomCharts visuals used

Drill Down Pie PRO (Pin) Drill Down Pie PRO (Pin)
Drill Down Map PRO Drill Down Map PRO
Drill Down Donut PRO Drill Down Donut PRO

4U Report Challenges

Participate in data challenges, build and submit reports to get free template downloads.

Join Community

Mobile view allows you to interact with the report. To Download the template please switch to desktop view.

Similar reports

All Reports 1 results
New
Report Card

National Fuel Market Analysis 6

496

Explore all reports

Was this helpful? Thank you for your feedback!

Sorry about that.

How can we improve it?

NATIONAL FUEL MARKET ANALYSIS ARGENTINA (2016-2023)

Report Author: Dereck Marin

798

ZoomCharts

Welcome to ZoomCharts

You’re almost there! Create an account to download reports.

or
Sign up with Microsoft

Verify your email address

We have sent a code to your email address. Please input the code below.

Didn't receive code? Request again (after 30 seconds)

Already have an account? Log in

ZoomCharts

Log in to your ZoomCharts account

Log in with Microsoft
or
Forgot password?

Reset your password

We'll email you instructions on how to reset your password

Don't have an account? Sign up

Please add credits

You have 0 available downloads.
Get more credits or upgrade your plan to continue.

View pricing
logo
[email protected]
+44 204 577 3993
logo

Products

Drill Down Bubble PRO Drill Down Line PRO Drill Down Network PRO Drill Down Waterfall PRO Drill Down Graph PRO Drill Down Combo PRO Drill Down Combo Bar PRO Drill Down Donut PRO Drill Down Pie PRO Drill Down TimeSeries PRO Drill Down Timeline PRO Drill Down Map PRO Drill Down Scatter PRO All Visuals

Resources

Report Examples Webinars Blog ZoomCharts Academy Visuals Gallery Documentation Custom Visual Development Subscribe to News

Solutions

Custom Visual Development

Company

Pricing About Us Partners Leave feedback Join PowerGroup EU Funding

Help

ZoomCharts Assistance Contact Sales Contact Support FAQ AI Information

Drill Down Line PRO Drill Down Bubble PRO Drill Down Network PRO Drill Down Waterfall PRO Drill Down Graph PRO Drill Down Combo PRO Drill Down Combo Bar PRO Drill Down Donut PRO Drill Down Pie PRO Drill Down TimeSeries PRO Drill Down Timeline PRO Drill Down Map PRO Drill Down Scatter PRO All Visuals

Report Examples Webinars Blog ZoomCharts Academy Visuals Gallery Documentation Custom Visual Development Subscribe to News

Custom Visual Development

Pricing About Us Partners Leave feedback Join PowerGroup EU Funding

ZoomCharts Assistance Contact Sales Contact Support FAQ AI Information
+44 204 577 3993
[email protected]

Ready to get in touch?

Contact our experts with any question about Power BI and ZoomCharts for Free!

Contact us

© 2026, Data Visualization Software Lab

U.S. Patents No. 11,645,343; 11,921,804; 12,346,389

Cookies
Privacy Policy
Global
Legal
Patent
warning

Error message

success

Success info: Done!

ZoomCharts AI Assistant

We noticed you're using an old OS version.

For the best experience, we recommend upgrading to ensure that all website features display correctly.

Cookie settings

We use necessary cookies for site functionality, as well as statistic, marketing, and preference cookies to enhance your experience. For more information and to manage your preferences, please visit our Cookie policy