1925
Movie Industry Insights: Decades of Releases and Revenue
Movie Industry Insights: Decades of Releases and Revenue
Report Author: Prathamesh Sawant
1925
Share template with others
Report submitted for Onyx Data DataDNA ZoomCharts Mini Challenge, April 2024. The report was built based on The Movie Database dataset and includes ZoomCharts custom Drill Down PRO visuals for Power BI.
Author's description:
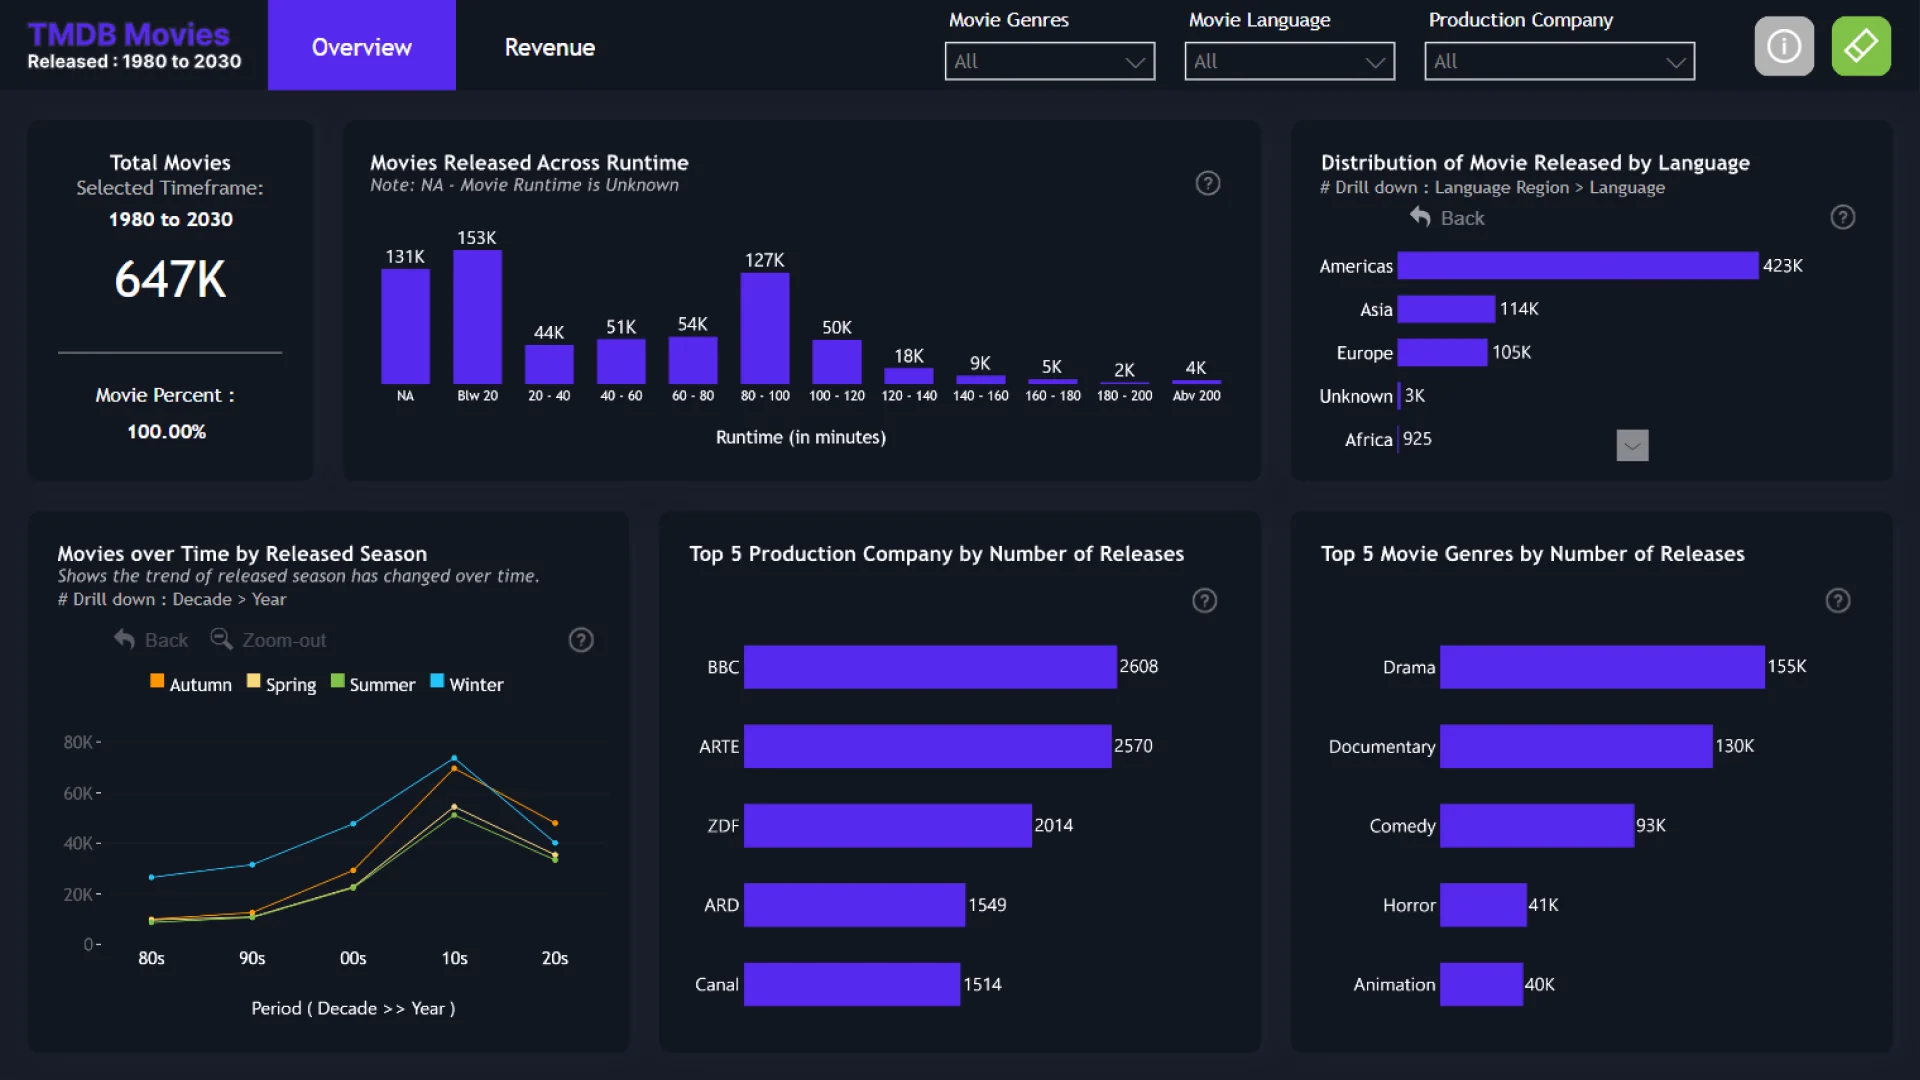
Explore the landscape of the movie industry through decades of releases and revenue in this Power BI report.
Overview Page:
Movies Released by Runtime: Understand movie length trends. Language Distribution: Explore movie diversity by language. Release Seasons: Visualize release trends across seasons. Top Production Companies: Identify leading studios by the number of releases. Top Genres: Discover popular genres by release count.
Revenue Page:
Revenue by Runtime: See how revenue varies with movie length. Language Revenue Distribution: Understand revenue contributions by language. Revenue by Production Company: Track revenue trends for major production companies. Top Revenue Companies: Identify studios with the highest revenue. Top Revenue Genres: Discover the most profitable genres.


4U Report Challenges
Participate in data challenges, build and submit reports to get free template downloads.
Join CommunityMobile view allows you to interact with the report. To Download the template please switch to desktop view.
How to use a PBIX template
Preview the interactive report, download the PBIX file, open it in Power BI Desktop, and replace the same data connection with your own dataset.
Preview and download
Explore the report online and download the PBIX template file.
Open in Power BI Desktop
Open the downloaded PBIX file in Power BI Desktop.
Connect your data
Replace the sample data source with your own dataset.
Refresh and adjust
Refresh the model and update fields or visual were needed.
Save and share
Save your report and publish it for your audience.


