logo
For Power BI
  • Products
    • Custom Visuals for Power BI
    • Report Templates
  • Resources

      Resources

    • Documentation
    • Report Examples
    • Blog
    • Webinars
    • Video Tutorials
    • Visuals Gallery

    Support

    • ZoomCharts Assistance
    • Contact Sales
    • Contact Support
    • FAQ

    Challenges

    Challenges

    Improve your report creation skills by participating in free challenges for report creators.

    Learn more
    Get Developer License
  • Services
    • Power BI Report Development
    • Custom Visual Development
  • Challenges
  • Pricing
    • Custom Visuals for Power BI
    • Report Templates
Subscribe
Subscribe
Get it now
Go back

Contents

Contest logo
Contest logo
Contest logo
Contest logo
Try Free Now
Go back

FP20 Analytics August 2024 Challenge

Report Author: Thao Thi Dieu Le

94

Mobile Games Analysis 2

Report
Report Interact

Combo Combo Bar Timeline Donut Sales Marketing

Share template with others

Report submitted for FP20 Analytics ZoomCharts Challenge 18 (August 2024). The report was built with the Mobile Game Analysis dataset and includes ZoomCharts custom Drill Down PRO visuals for Power BI. 

Author's description:
The report I created includes two pages: an overview and detailed game insights. It offers key insights into the current gaming market, covering trends in ratings, pricing, user engagement, and genres, along with recommendations for new developers on selecting the right price points or genres to succeed in the market. This dashboard specifically analyzes apps that are actively used by users, meaning those that have received user ratings.

Key Insights:
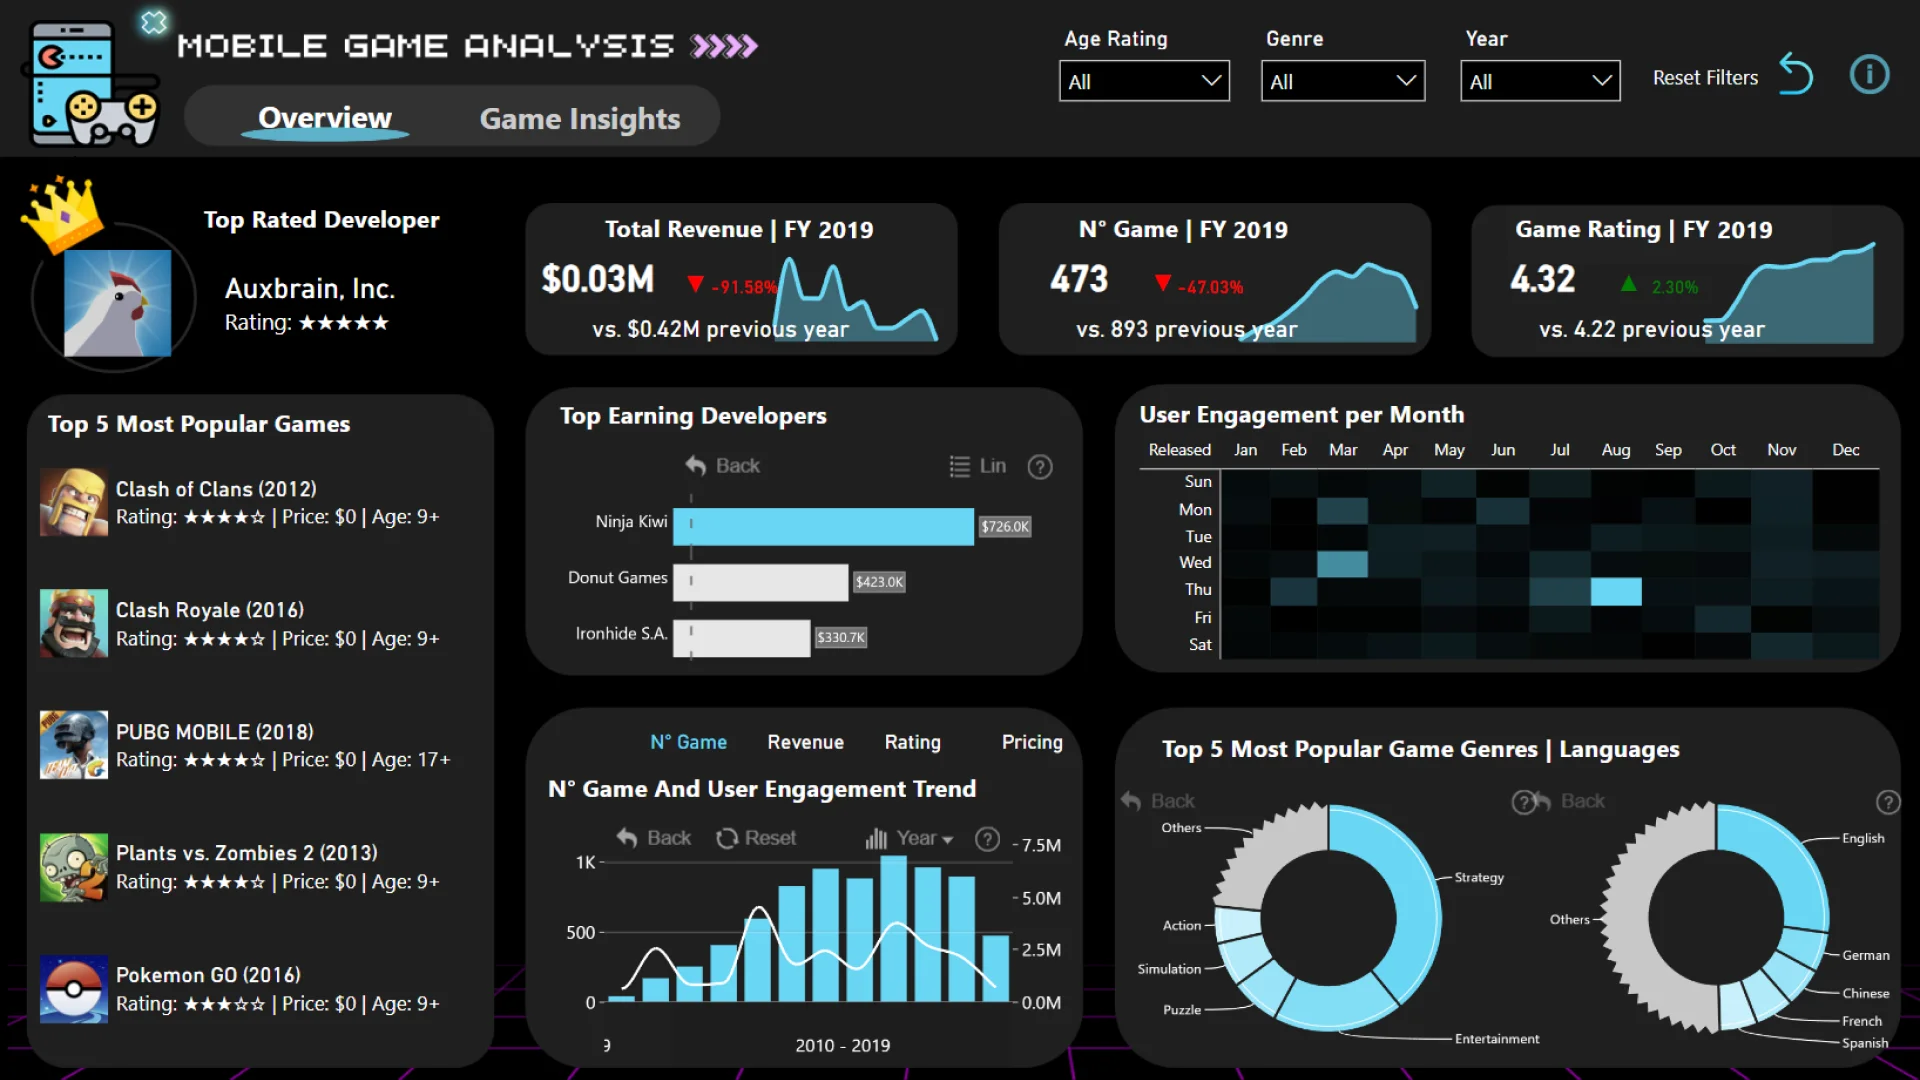
- The top 5 most popular games from 2008 to 2019 are all free-to-play, with Clash of Clans (2012) and Clash Royale (2016) leading the list, both targeting players aged 9+.
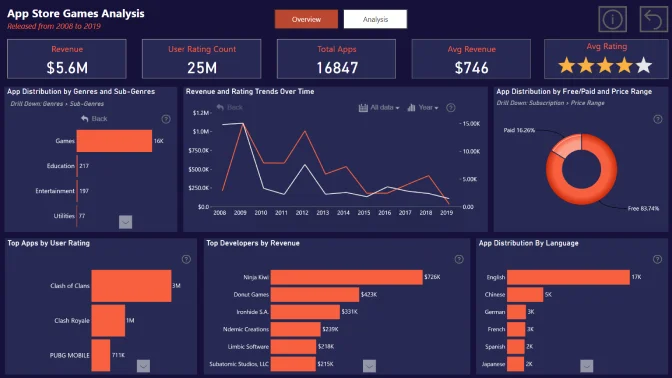
- Game revenue fluctuated between 2008 and 2019, peaking in 2009 and hitting a low in 2019, despite the number of games in 2019 being more than double those in 2009. This could be due to the higher presence of paid games with strong user engagement in 2009. Among developers, Ninja Kiwi generated the highest revenue, followed by Donut Games and Iron Hide.
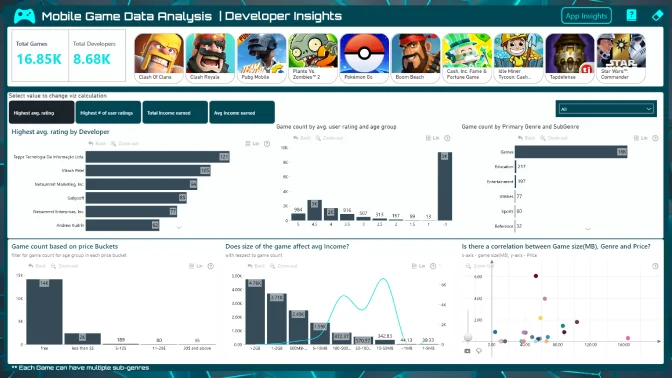
- The number of game launches saw significant growth from 2008 to 2016 before declining to nearly half of its peak by 2019, although average game ratings improved during this period. Auxbrain emerged as the developer with the highest average composite game rating which is based on average user rating and average user rating count. Additionally, average game prices decreased from 2008 to 2019, with lower-priced games showing higher user engagement. Clash Royale, PUBG Mobile, and Pokémon Go had the highest user engagement (i.e., user rating counts) from 2016 to 2019.
- Strategy games and English language options are the most popular in their respective categories. New developers should consider focusing on these to attract a larger audience.
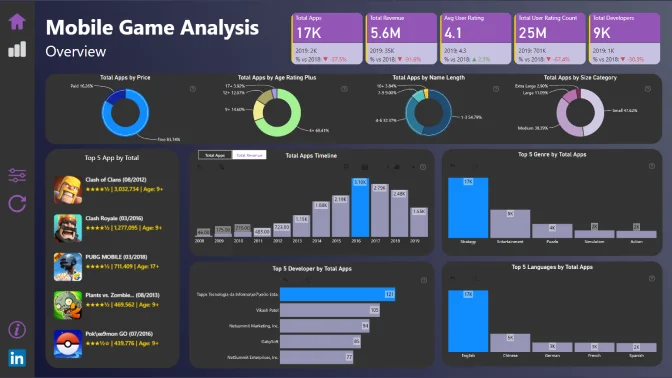
- The majority of games in the app store are free or priced below $4.99, categories that seem to draw the most players. It is recommended that new developers adopt a similar pricing strategy, potentially offering free games monetized through advertising or setting a low price point.
- There is a positive correlation between price and game size, with larger games typically having higher unit prices. However, free and low-priced games often receive higher user ratings and user engagement. Strategy and entertainment genres tend to feature larger games.
- While games rated for ages 4+ are the most prevalent in the market, those rated for ages 9+ see greater user engagement. Over 50% of games receive excellent user ratings (above 4.5), with strategy and entertainment genres leading in this area. Based on the insights provided, it is recommended that new game developers should target players interested in free or low-priced games, focus on the 9+ age group, create strategy and entertainment games, and prioritize English-speaking audiences. By focusing on these segments, new developers can maximize their chances of success in a competitive market.

ZoomCharts visuals used

Drill Down Combo PRO Drill Down Combo PRO
Drill Down Combo Bar PRO Drill Down Combo Bar PRO
Drill Down Timeline PRO Drill Down Timeline PRO
Drill Down Donut PRO Drill Down Donut PRO

Need help?

Send your question to ZoomCharts assistant, and we will respond to you as soon as possible.

Contact Us

Mobile view allows you to interact with the report. To Download the template please switch to desktop view.

Report Overhaul

ZoomCharts Academy

Learn ZoomCharts with experts and become certified!

Go to Academy!
Report Overhaul

Was this helpful? Thank you for your feedback!

Sorry about that.

How can we improve it?

Mobile Games Analysis 2

Share

ZoomCharts

Welcome to ZoomCharts

You’re almost there! Create an account to keep your saved reports.

or
Sign up with Microsoft

Verify your email address

We have sent a code to your email address. Please input the code below.

Didn't receive code? Request again (after 30 seconds)

Already have an account? Log in

ZoomCharts

Log in to your ZoomCharts account

Log in with Microsoft
or
Forgot password?

Reset your password

We'll email you instructions on how to reset your password

Don't have an account? Sign up

Please add credits

You have 0 available downloads.
Get more credits or upgrade your plan to continue.

View pricing
logo
[email protected]
+44 204 577 3993
logo

Products

Drill Down Network PRO Drill Down Waterfall PRO Drill Down Graph PRO Drill Down Combo PRO Drill Down Combo Bar PRO Drill Down Donut PRO Drill Down Pie PRO Drill Down TimeSeries PRO Drill Down Timeline PRO Drill Down Map PRO Drill Down Scatter PRO All Visuals

Resources

Report Examples Webinars Blog ZoomCharts Academy Visuals Gallery Documentation Custom Visual Development Subscribe to News

Solutions

Custom Visual Development

Company

Pricing About Us Partners Leave feedback Join PowerGroup EU Funding

Help

ZoomCharts Assistance Contact Sales Contact Support FAQ

Drill Down Network PRO Drill Down Waterfall PRO Drill Down Graph PRO Drill Down Combo PRO Drill Down Combo Bar PRO Drill Down Donut PRO Drill Down Pie PRO Drill Down TimeSeries PRO Drill Down Timeline PRO Drill Down Map PRO Drill Down Scatter PRO All Visuals

Report Examples Webinars Blog ZoomCharts Academy Visuals Gallery Documentation Custom Visual Development Subscribe to News

Custom Visual Development

Pricing About Us Partners Leave feedback Join PowerGroup EU Funding

ZoomCharts Assistance Contact Sales Contact Support FAQ
+44 204 577 3993
[email protected]

Ready to get in touch?

Contact our experts with any question about Power BI and ZoomCharts for Free!

Contact us

© 2025, Data Visualization Software Lab

U.S. Patents No. 11,645,343; 11,921,804; 12,346,389

Cookies
Privacy Policy
Global
Legal
Patent
warning

Error message

success

Success info: Done!

ZoomCharts AI Assistant

We noticed you're using an old OS version.

For the best experience, we recommend upgrading to ensure that all website features display correctly.

Cookie settings

We use necessary cookies for site functionality, as well as statistic, marketing, and preference cookies to enhance your experience. For more information and to manage your preferences, please visit our Cookie policy