490
Marketing Email Campaign Dashboard | Dylan Hiep
Marketing Email Campaign Dashboard | Dylan Hiep
Report Author: Hiep Le Dai
490
Share template with others
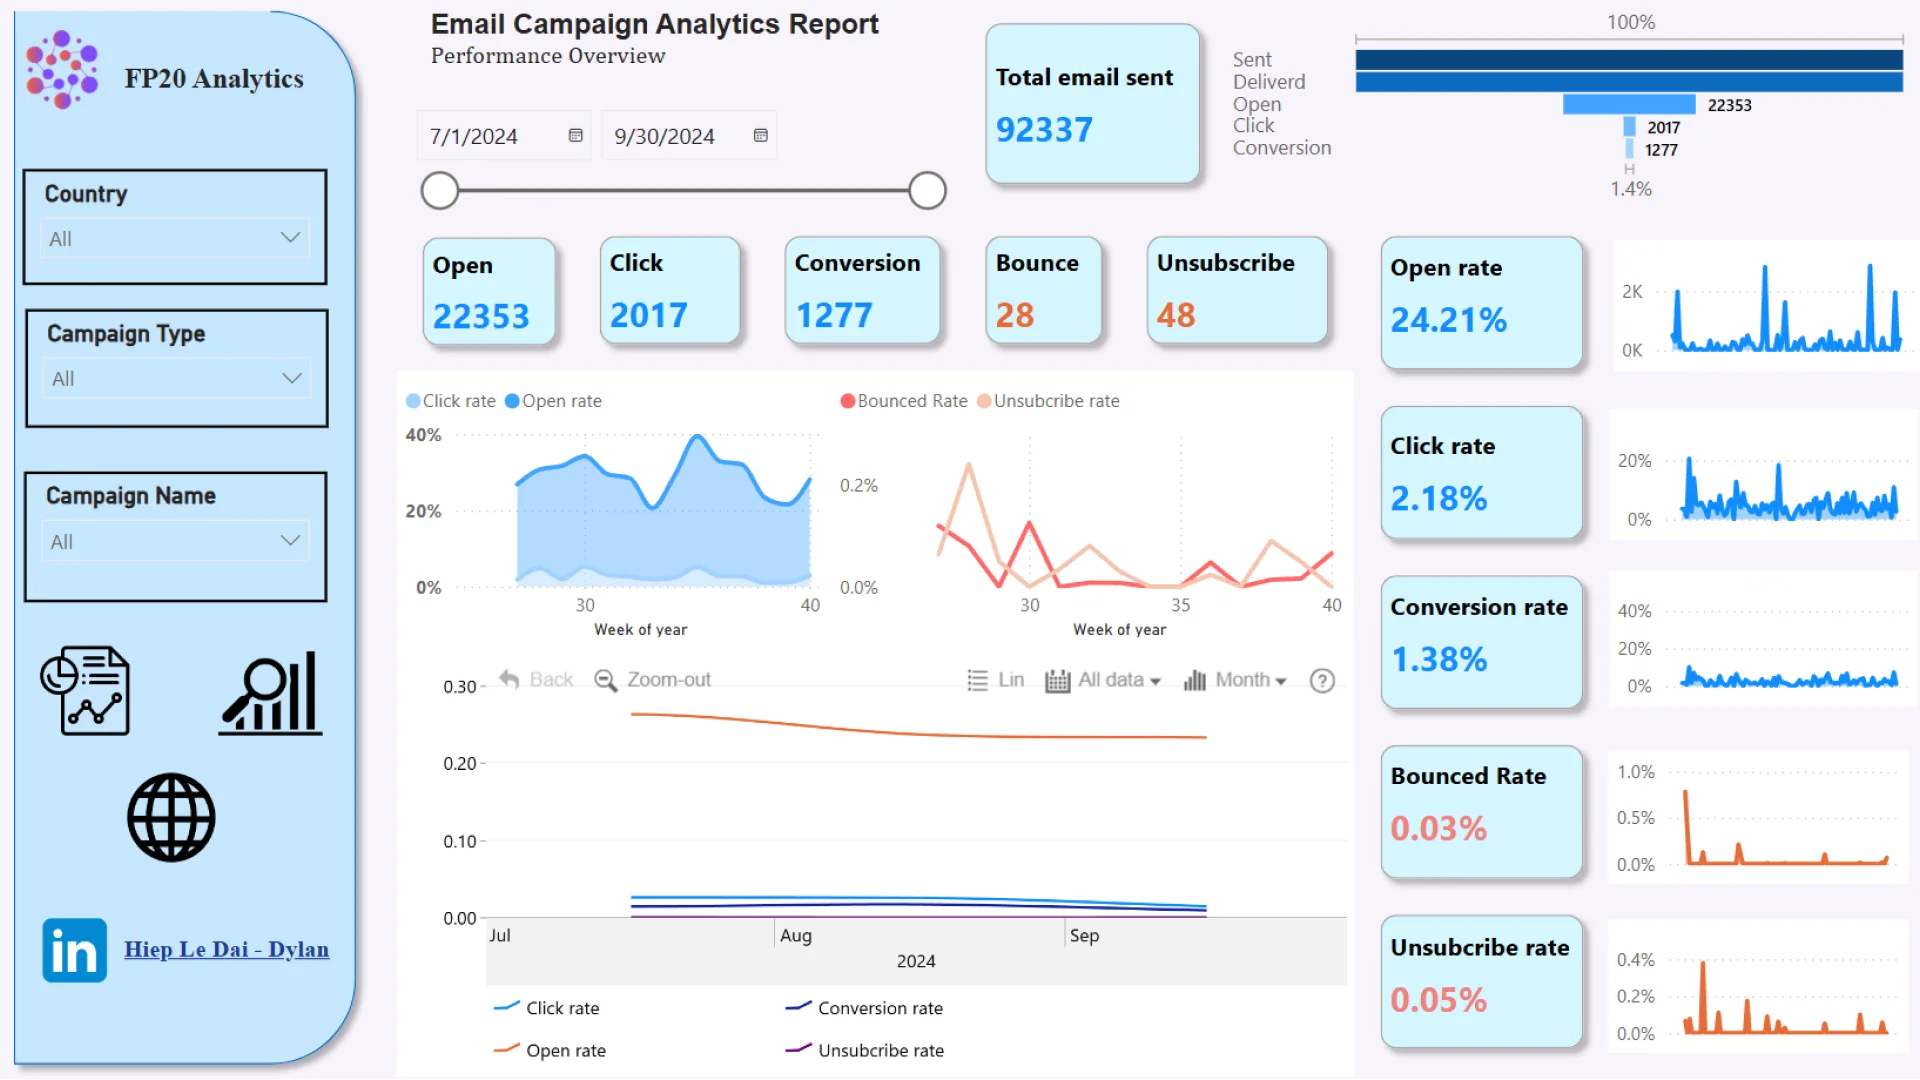
Report submitted for the FP20 Analytics ZoomCharts Challenge, October 2024. The report was built using the Marketing Email Campaign performance dataset and includes ZoomCharts custom Drill Down PRO visuals for Power BI.
Author's Description:The Power BI report presents key metrics for analyzing email marketing performance. The first page provides an overview of data such as open rate, click rate, conversion rate, bounce rate, and unsubscribe rate, highlighting the correlation between these metrics and their changes over time. The second page offers a detailed analysis by device, conversion target, email domain, and campaign type. The final page breaks down metrics by country.
ZoomCharts visuals used
4U Report Challenges
Participate in data challenges, build and submit reports to get free template downloads.
Join CommunityMobile view allows you to interact with the report. To Download the template please switch to desktop view.


Was this helpful? Thank you for your feedback!
Sorry about that.
How can we improve it?