logo
For Power BI
  • Products
    • Custom Visuals for Power BI
    • Report Templates
  • Resources

      Resources

    • Documentation
    • Report Examples
    • Blog
    • Webinars
    • Video Tutorials
    • Visuals Gallery

    Support

    • ZoomCharts Assistance
    • Contact Sales
    • Contact Support
    • FAQ

    Challenges

    Challenges

    Improve your report creation skills by participating in free challenges for report creators.

    Learn more
    Get Developer License
  • Services
    • Power BI Report Development
    • Custom Visual Development
  • Challenges
  • Pricing
    • Custom Visuals for Power BI
    • Report Templates
Subscribe
Subscribe
Get it now
Go back

Contents

Contest logo
Contest logo
Contest logo
Contest logo
Try Free Now
Go back

FP20 Analytics October 2024 Challenge

Report Author: Minautee Minautee

167

Marketing Campaign Performance Dashboard

Report
Report Interact

Pie Combo Combo Bar Marketing

Share template with others

Report submitted for the FP20 Analytics ZoomCharts Challenge, October 2024. The report was built using the Marketing Email Campaign performance dataset and includes ZoomCharts custom Drill Down PRO visuals for Power BI.

Author's description:

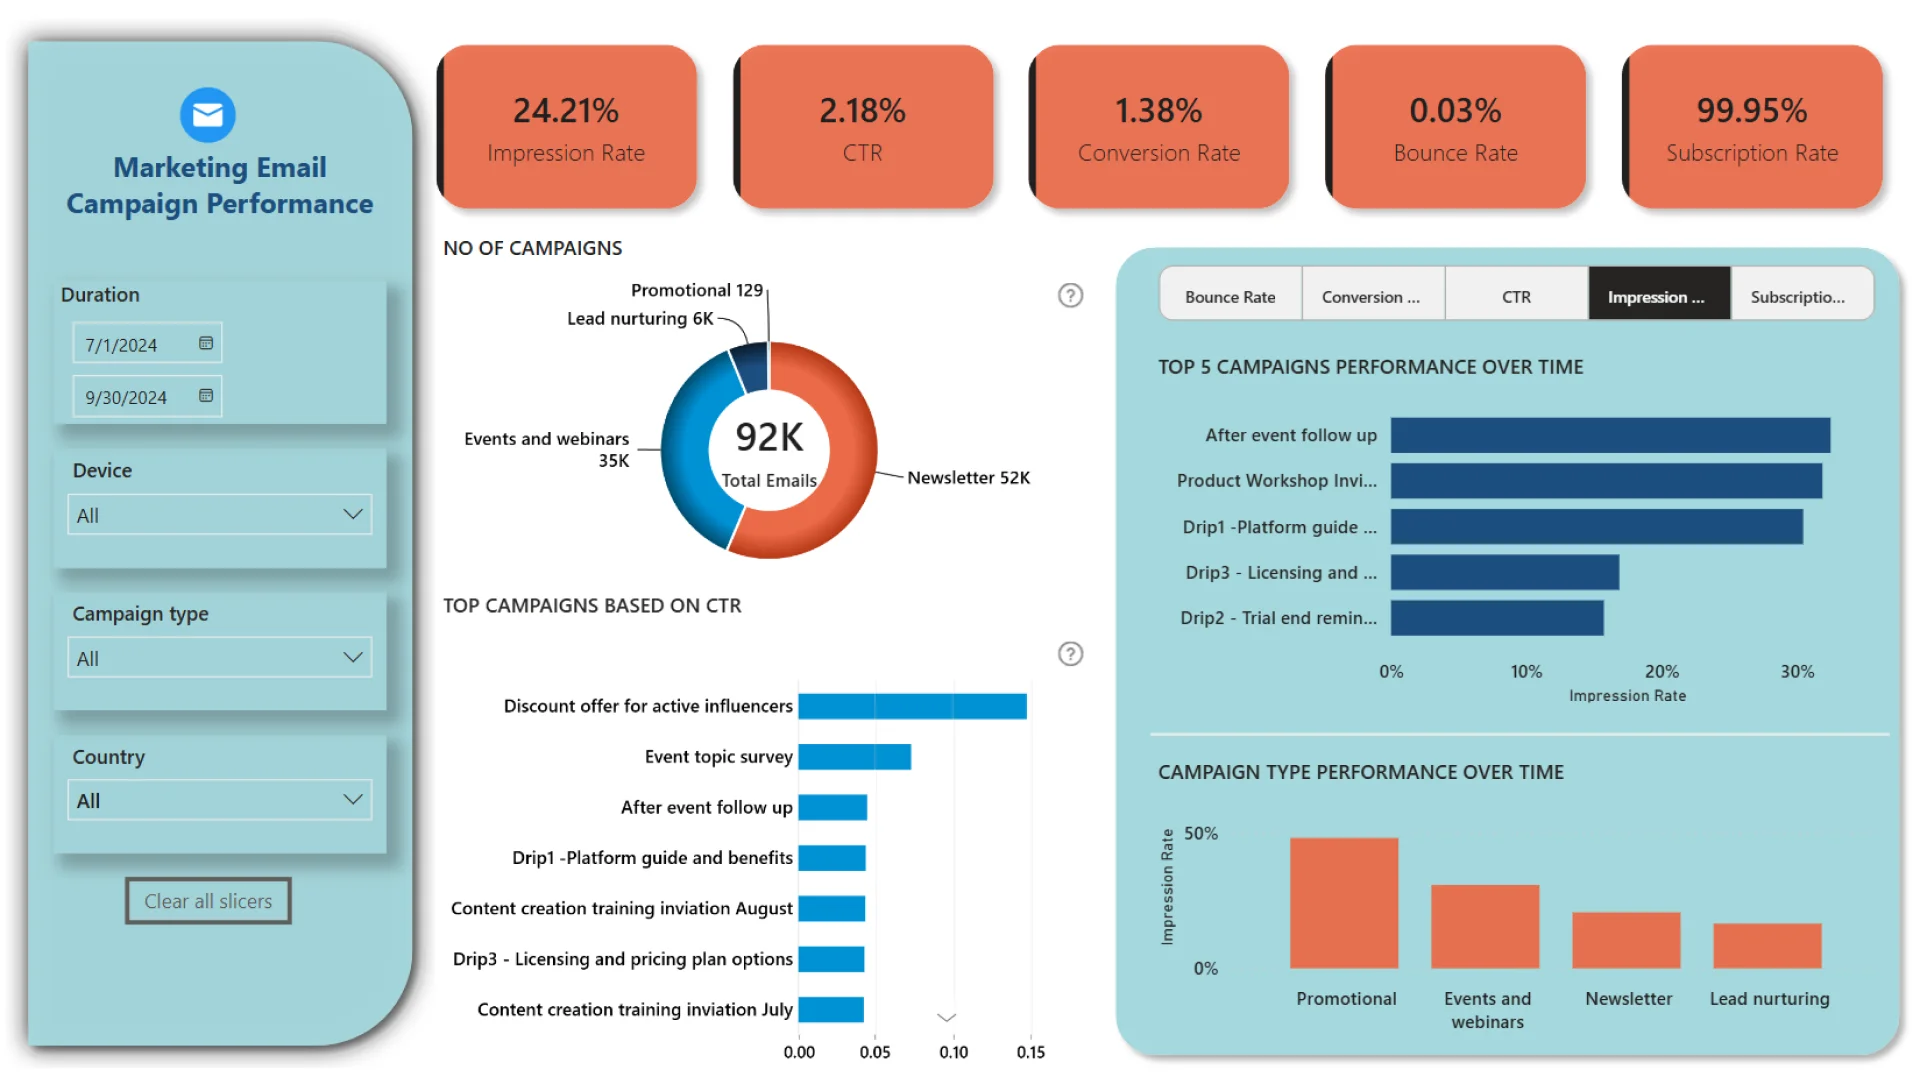
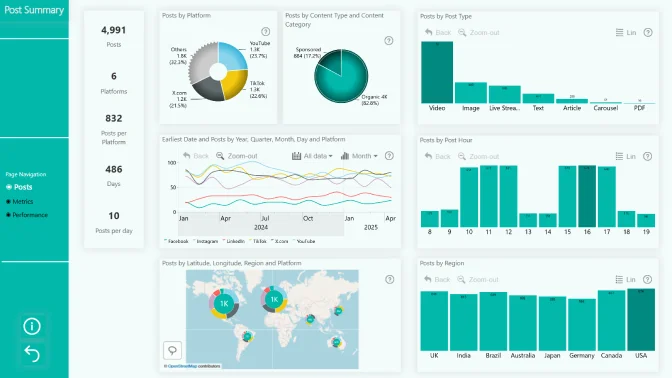
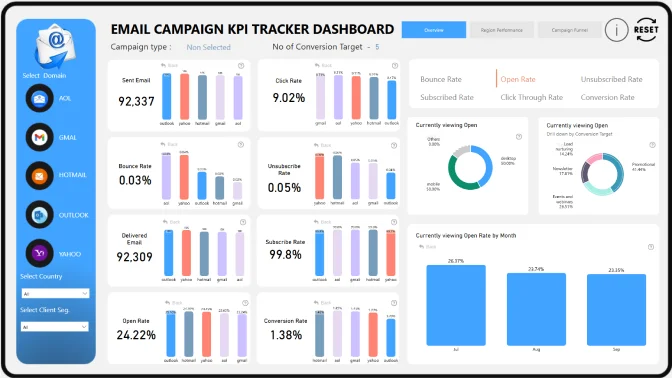
This dashboard provides an insightful overview of email marketing campaign performance, designed to help the marketing team assess and optimize the effectiveness of different campaign types. Key performance indicators (KPIs) such as Impression Rate, Click-Through Rate (CTR), Conversion Rate, Bounce Rate, and Subscription Rate offer a comprehensive view of campaign engagement and impact.

Key Metrics:

  • Impression Rate - 24.21%: Measures campaign reach, indicating the percentage of emails viewed by recipients.
  • Click-Through Rate (CTR) - 2.18%: Calculates the percentage of recipients who clicked on links within the emails, showing engagement levels.
  • Conversion Rate - 1.38%: Reflects the success of campaigns in achieving conversion goals, such as purchases or sign-ups.
  • Bounce Rate - 0.03%: Indicates email deliverability; a lower rate demonstrates effective list management.
  • Subscription Rate - 99.95%: Measures the retention rate, showing the proportion of recipients who remained subscribed.
  • Total Emails Sent - 92K: Represents the total number of emails sent across all campaigns during the selected period.

Campaign Types:

  • Promotional: 129 campaigns
  • Lead Nurturing: 6K emails
  • Events and Webinars: 35K emails
  • Newsletter: 52K emails

Top Campaigns by CTR:

Highlights the highest-performing campaigns based on click-through rates, including:

  • "Discount Offer for Active Influencers" at 14.73%
  • "Event Topic Survey" at 7.27%

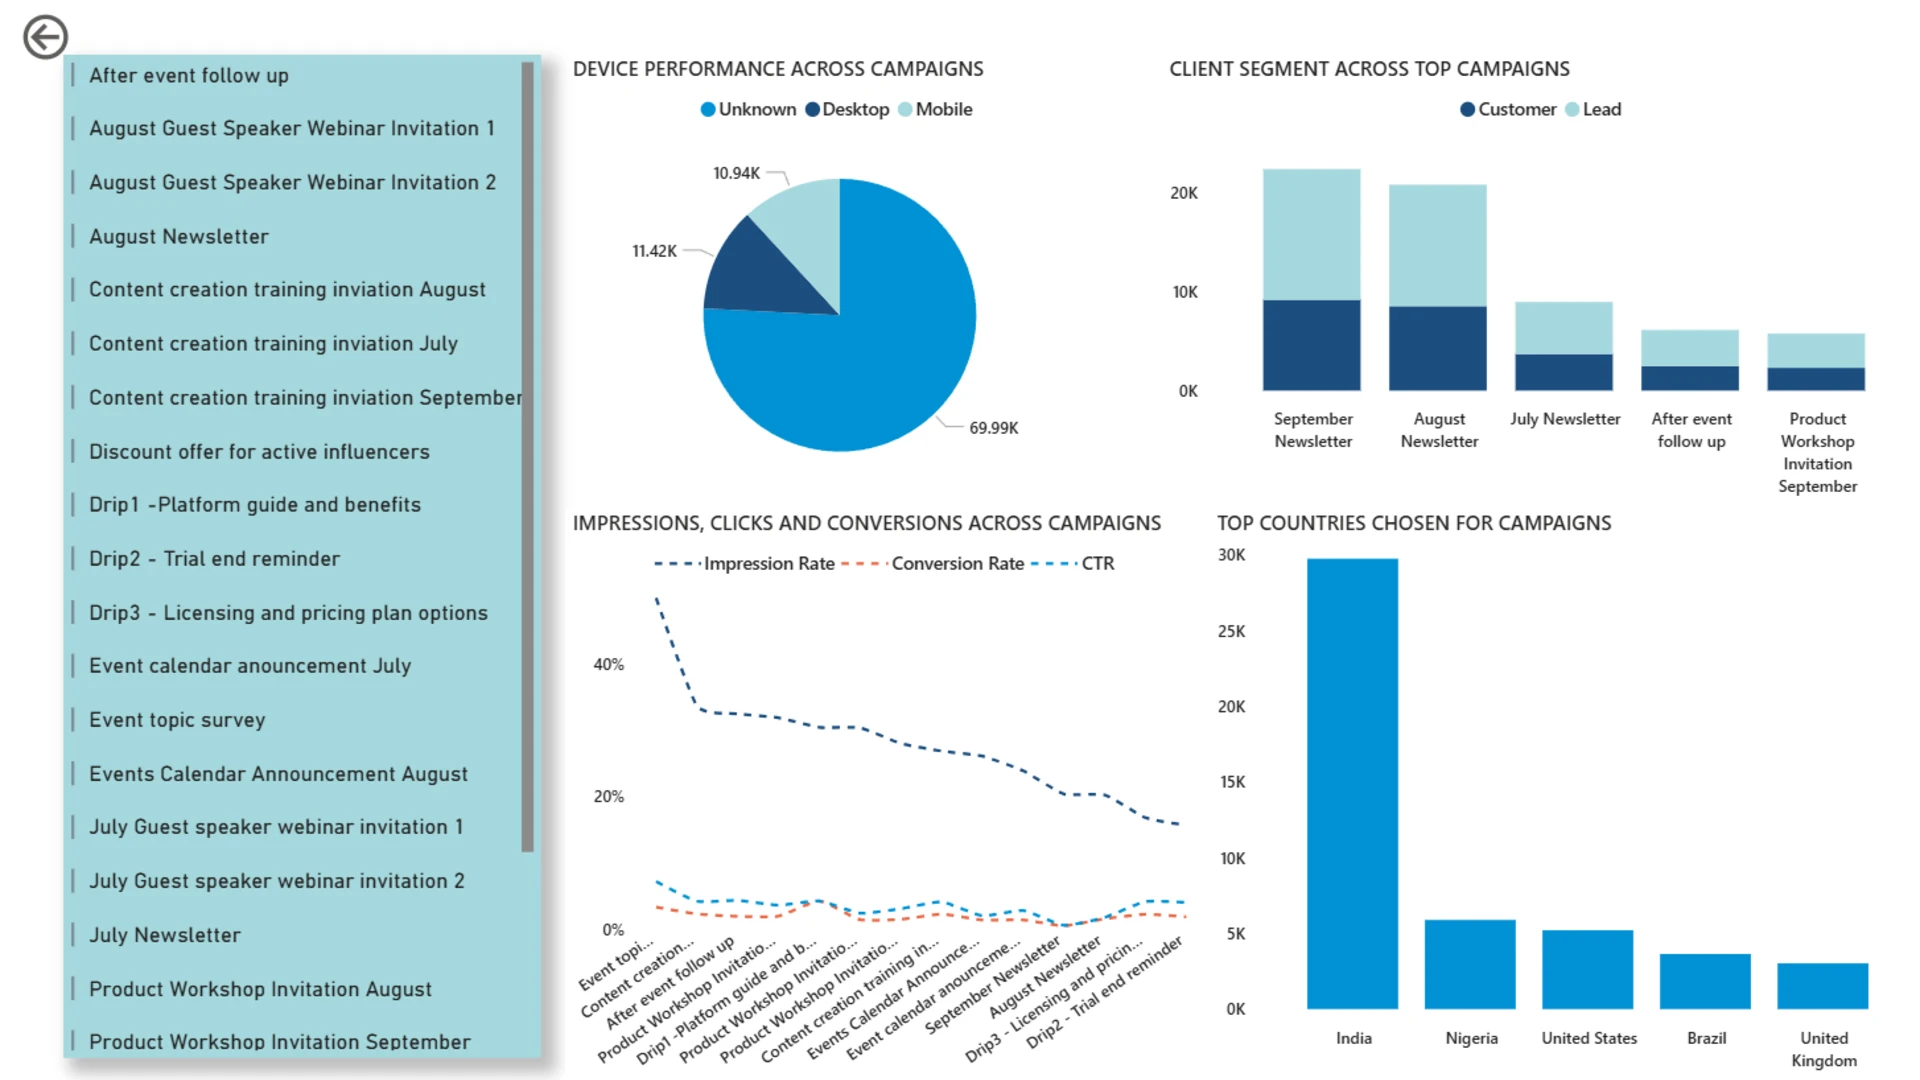
Drill-Through Feature:

The dashboard includes a drill-through feature on campaign types, allowing users to dive deeper into the performance of individual campaigns within each category (e.g., Promotional, Events and Webinars, Newsletters, and Lead Nurturing). Users can access detailed insights such as CTR, impression rate, and conversion performance, aiding in targeted campaign analysis.

Conclusion:

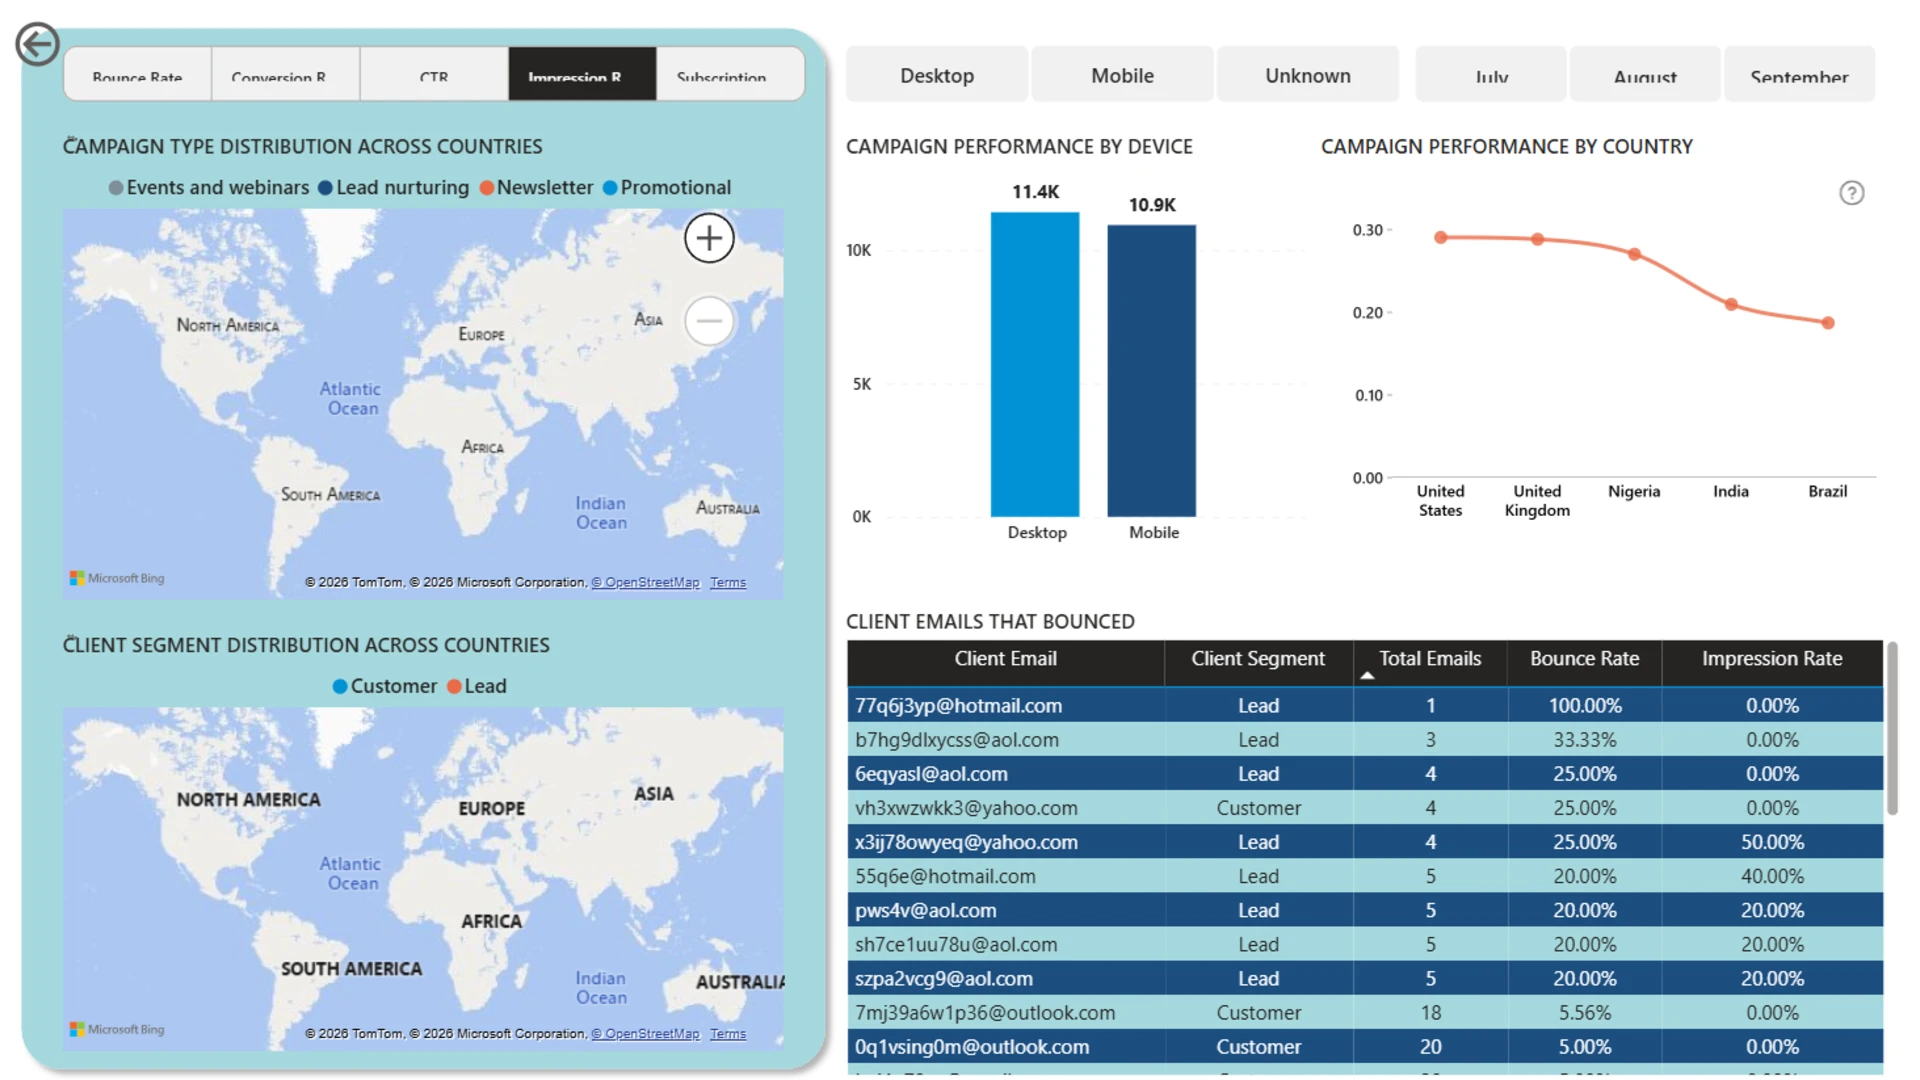
This dashboard addresses ad hoc questions related to the performance of marketing emails, while providing an extensive and comprehensive analysis of campaigns across devices, countries, and client segments. It enables a deeper understanding of what resonates best with the audience, guiding data-driven decision-making for future campaigns.

ZoomCharts visuals used

Drill Down Combo PRO Drill Down Combo PRO
Drill Down Combo Bar PRO Drill Down Combo Bar PRO
Drill Down Pie PRO Drill Down Pie PRO

Need help?

Send your question to ZoomCharts assistant, and we will respond to you as soon as possible.

Contact Us

Mobile view allows you to interact with the report. To Download the template please switch to desktop view.

Report Overhaul

ZoomCharts Academy

Learn ZoomCharts with experts and become certified!

Go to Academy!
Report Overhaul

Was this helpful? Thank you for your feedback!

Sorry about that.

How can we improve it?

Marketing Campaign Performance Dashboard

Share

ZoomCharts

Welcome to ZoomCharts

You’re almost there! Create an account to keep your saved reports.

or
Sign up with Microsoft

Verify your email address

We have sent a code to your email address. Please input the code below.

Didn't receive code? Request again (after 30 seconds)

Already have an account? Log in

ZoomCharts

Log in to your ZoomCharts account

Log in with Microsoft
or
Forgot password?

Reset your password

We'll email you instructions on how to reset your password

Don't have an account? Sign up

Please add credits

You have 0 available downloads.
Get more credits or upgrade your plan to continue.

View pricing
logo
[email protected]
+44 204 577 3993
logo

Products

Drill Down Network PRO Drill Down Waterfall PRO Drill Down Graph PRO Drill Down Combo PRO Drill Down Combo Bar PRO Drill Down Donut PRO Drill Down Pie PRO Drill Down TimeSeries PRO Drill Down Timeline PRO Drill Down Map PRO Drill Down Scatter PRO All Visuals

Resources

Report Examples Webinars Blog ZoomCharts Academy Visuals Gallery Documentation Custom Visual Development Subscribe to News

Solutions

Custom Visual Development

Company

Pricing About Us Partners Leave feedback Join PowerGroup EU Funding

Help

ZoomCharts Assistance Contact Sales Contact Support FAQ

Drill Down Network PRO Drill Down Waterfall PRO Drill Down Graph PRO Drill Down Combo PRO Drill Down Combo Bar PRO Drill Down Donut PRO Drill Down Pie PRO Drill Down TimeSeries PRO Drill Down Timeline PRO Drill Down Map PRO Drill Down Scatter PRO All Visuals

Report Examples Webinars Blog ZoomCharts Academy Visuals Gallery Documentation Custom Visual Development Subscribe to News

Custom Visual Development

Pricing About Us Partners Leave feedback Join PowerGroup EU Funding

ZoomCharts Assistance Contact Sales Contact Support FAQ
+44 204 577 3993
[email protected]

Ready to get in touch?

Contact our experts with any question about Power BI and ZoomCharts for Free!

Contact us

© 2025, Data Visualization Software Lab

U.S. Patents No. 11,645,343; 11,921,804; 12,346,389

Cookies
Privacy Policy
Global
Legal
Patent
warning

Error message

success

Success info: Done!

ZoomCharts AI Assistant

We noticed you're using an old OS version.

For the best experience, we recommend upgrading to ensure that all website features display correctly.

Cookie settings

We use necessary cookies for site functionality, as well as statistic, marketing, and preference cookies to enhance your experience. For more information and to manage your preferences, please visit our Cookie policy