884
Marketing Campaign Performance Dashboard
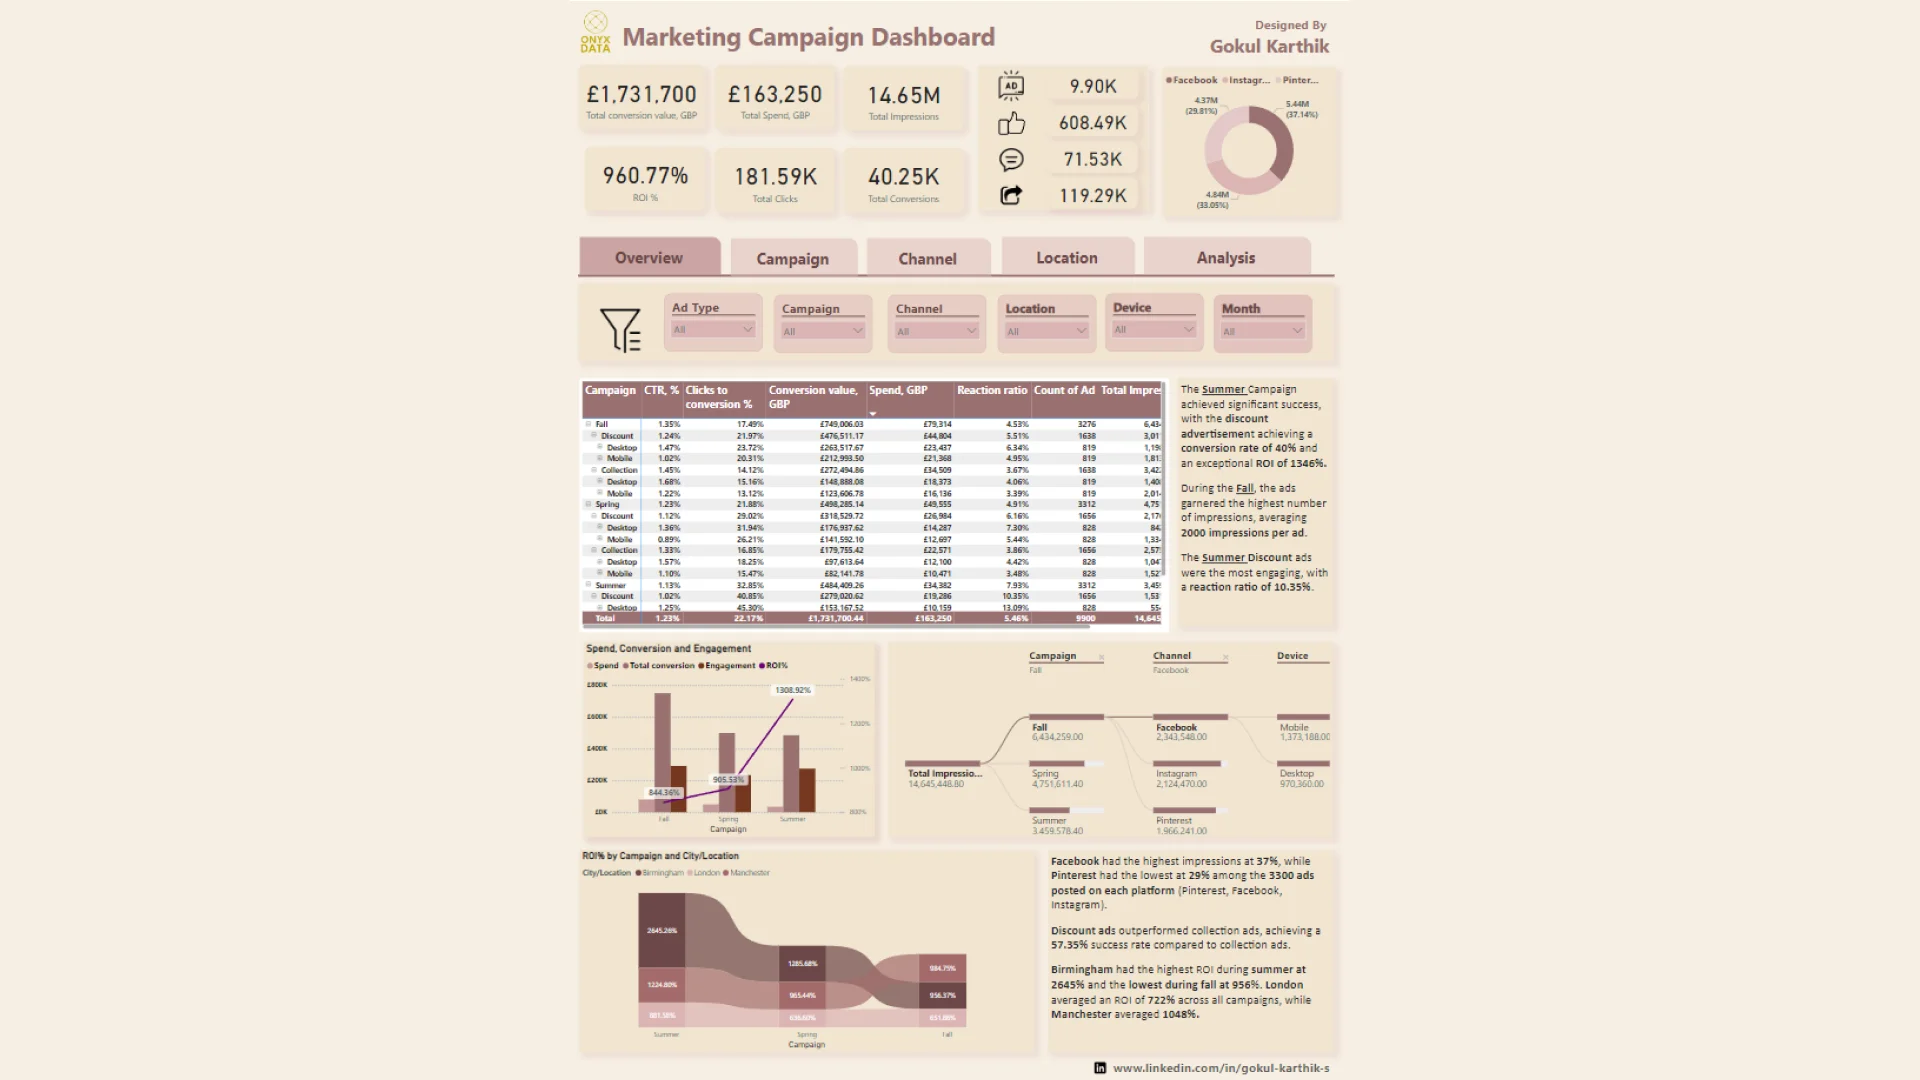
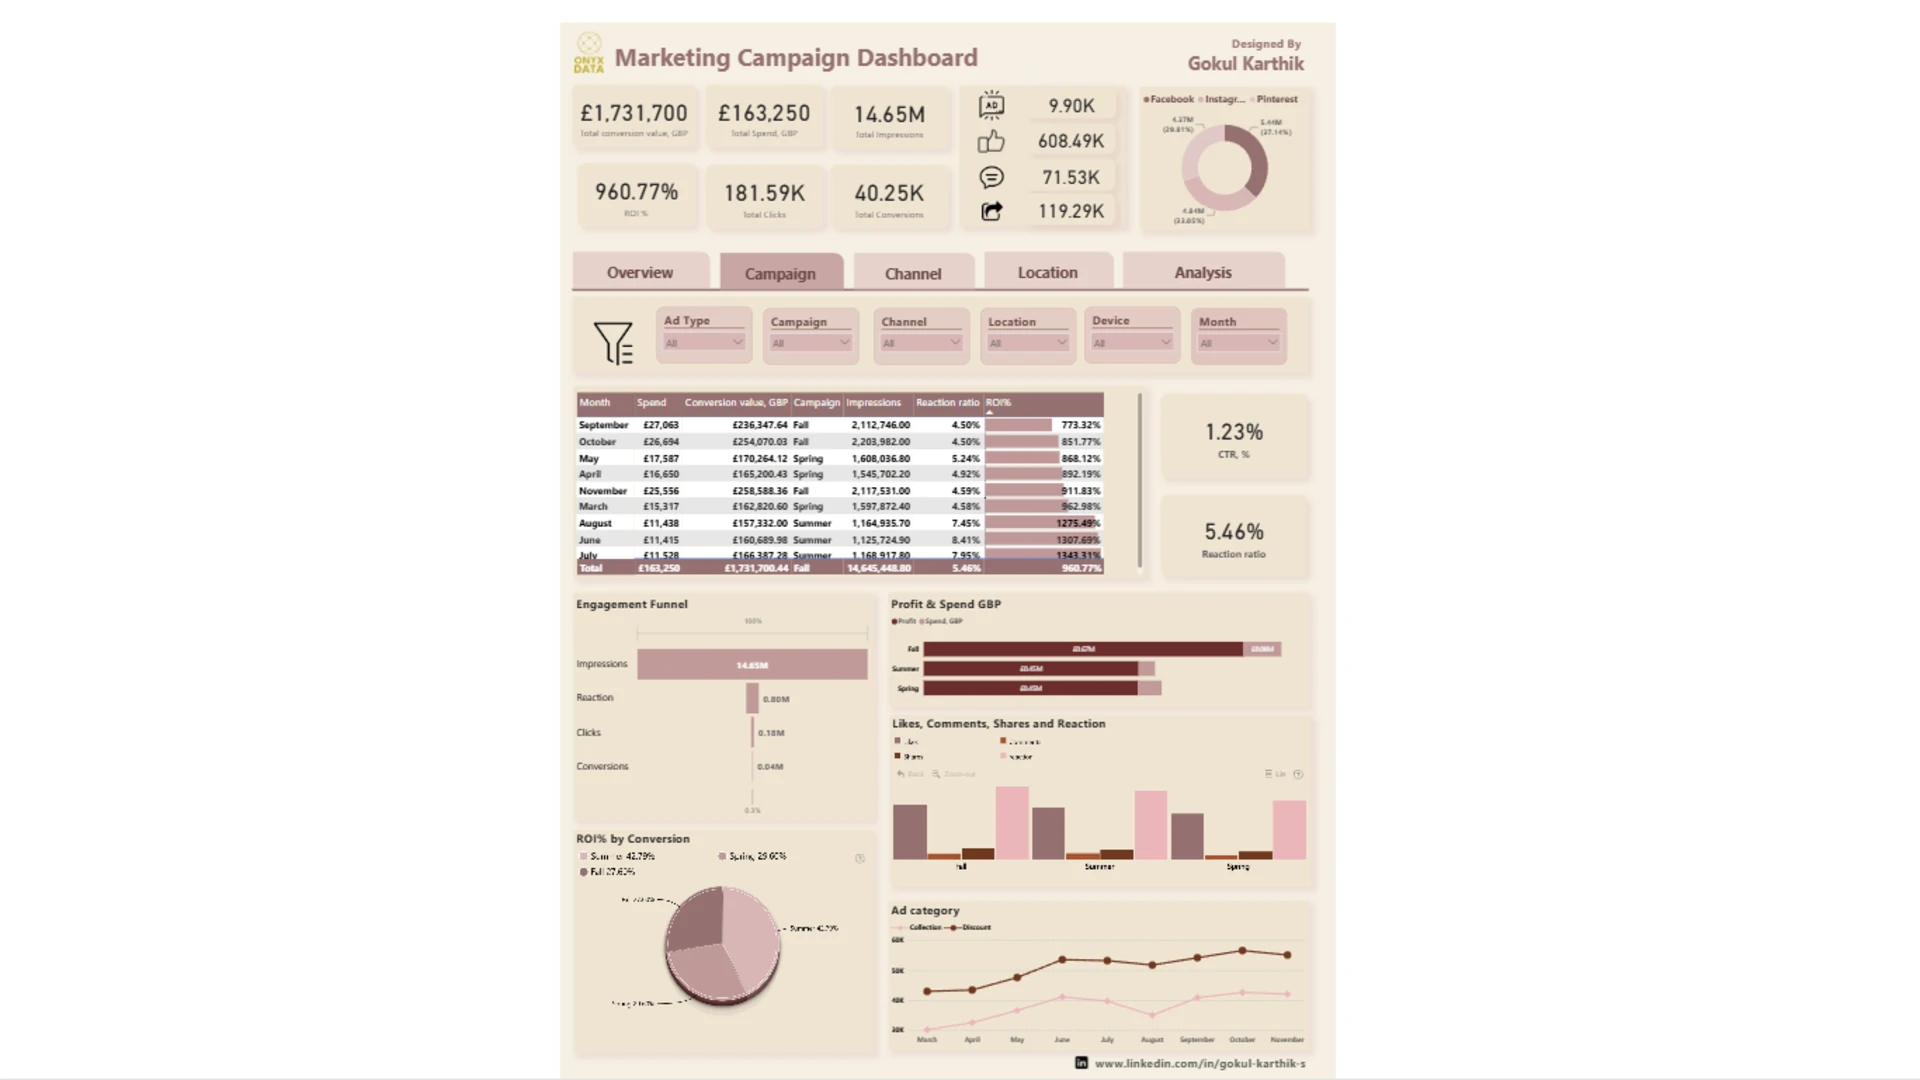
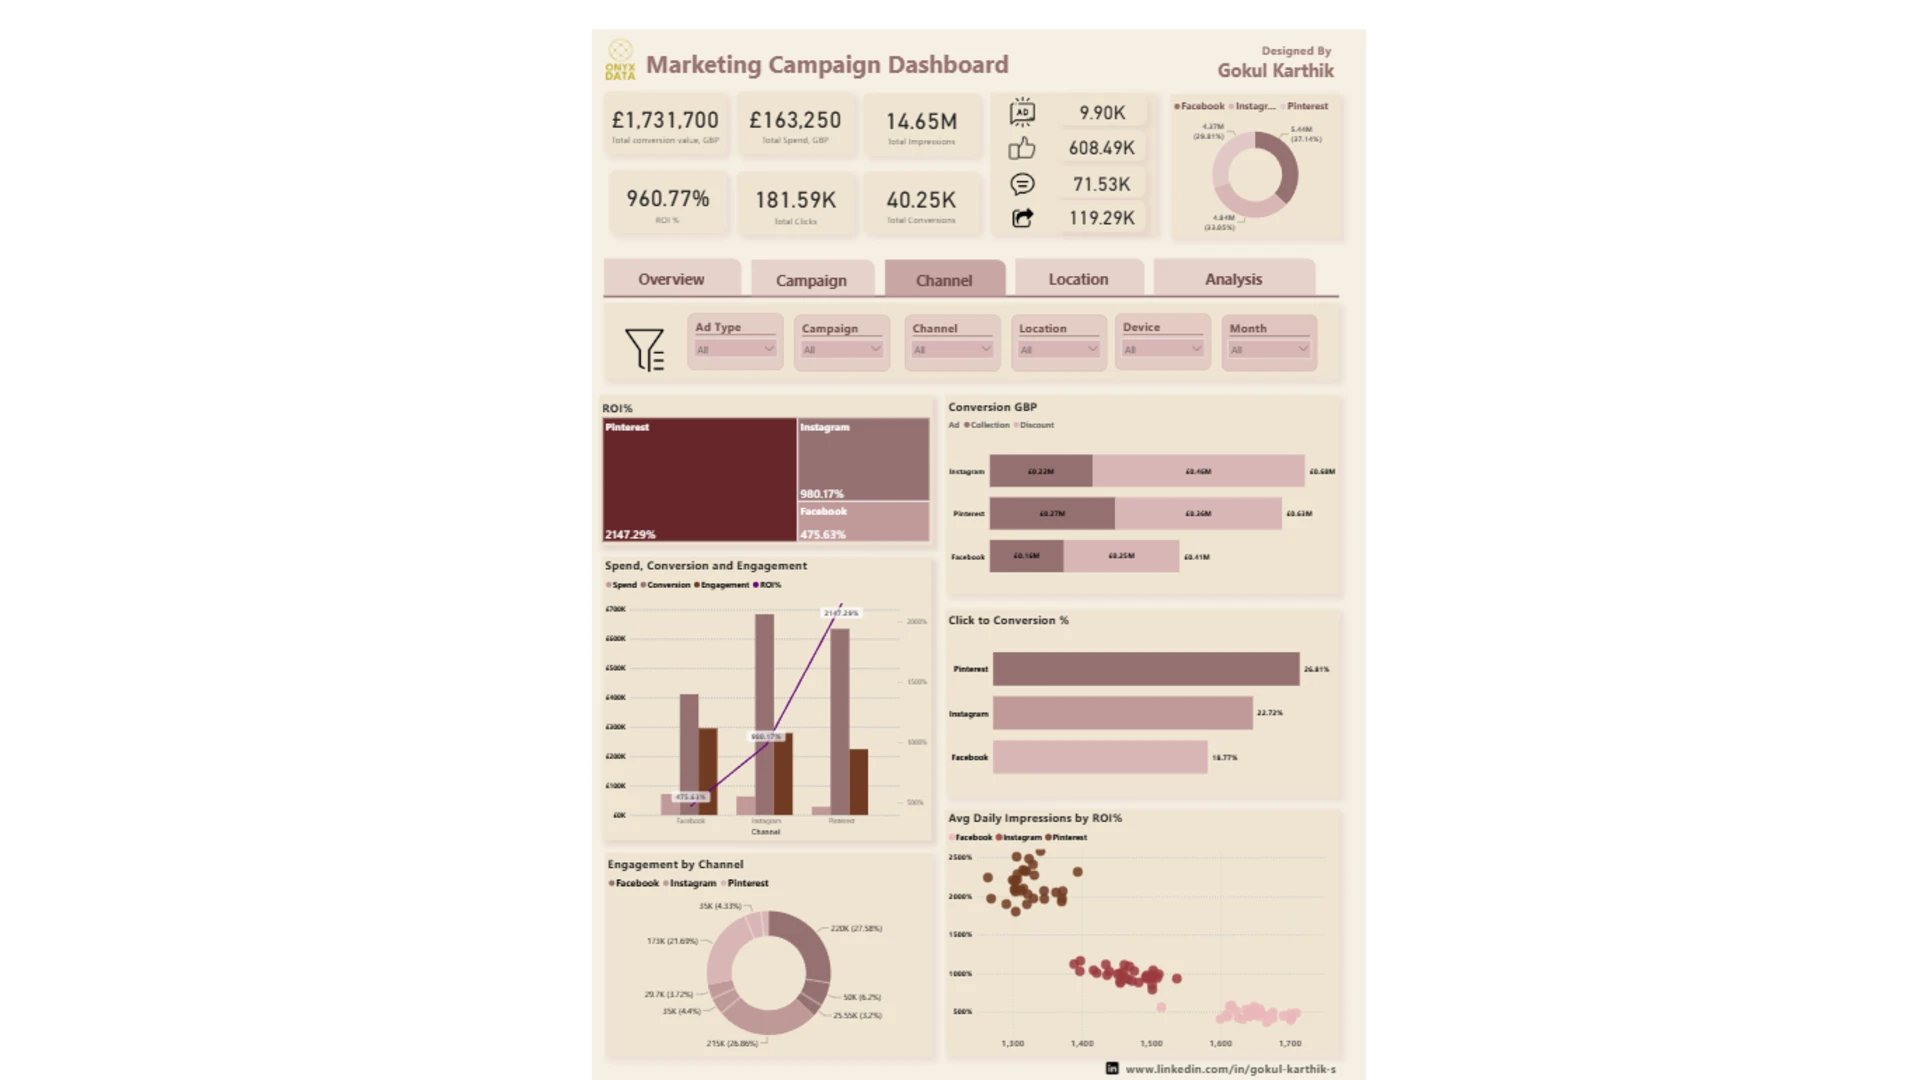
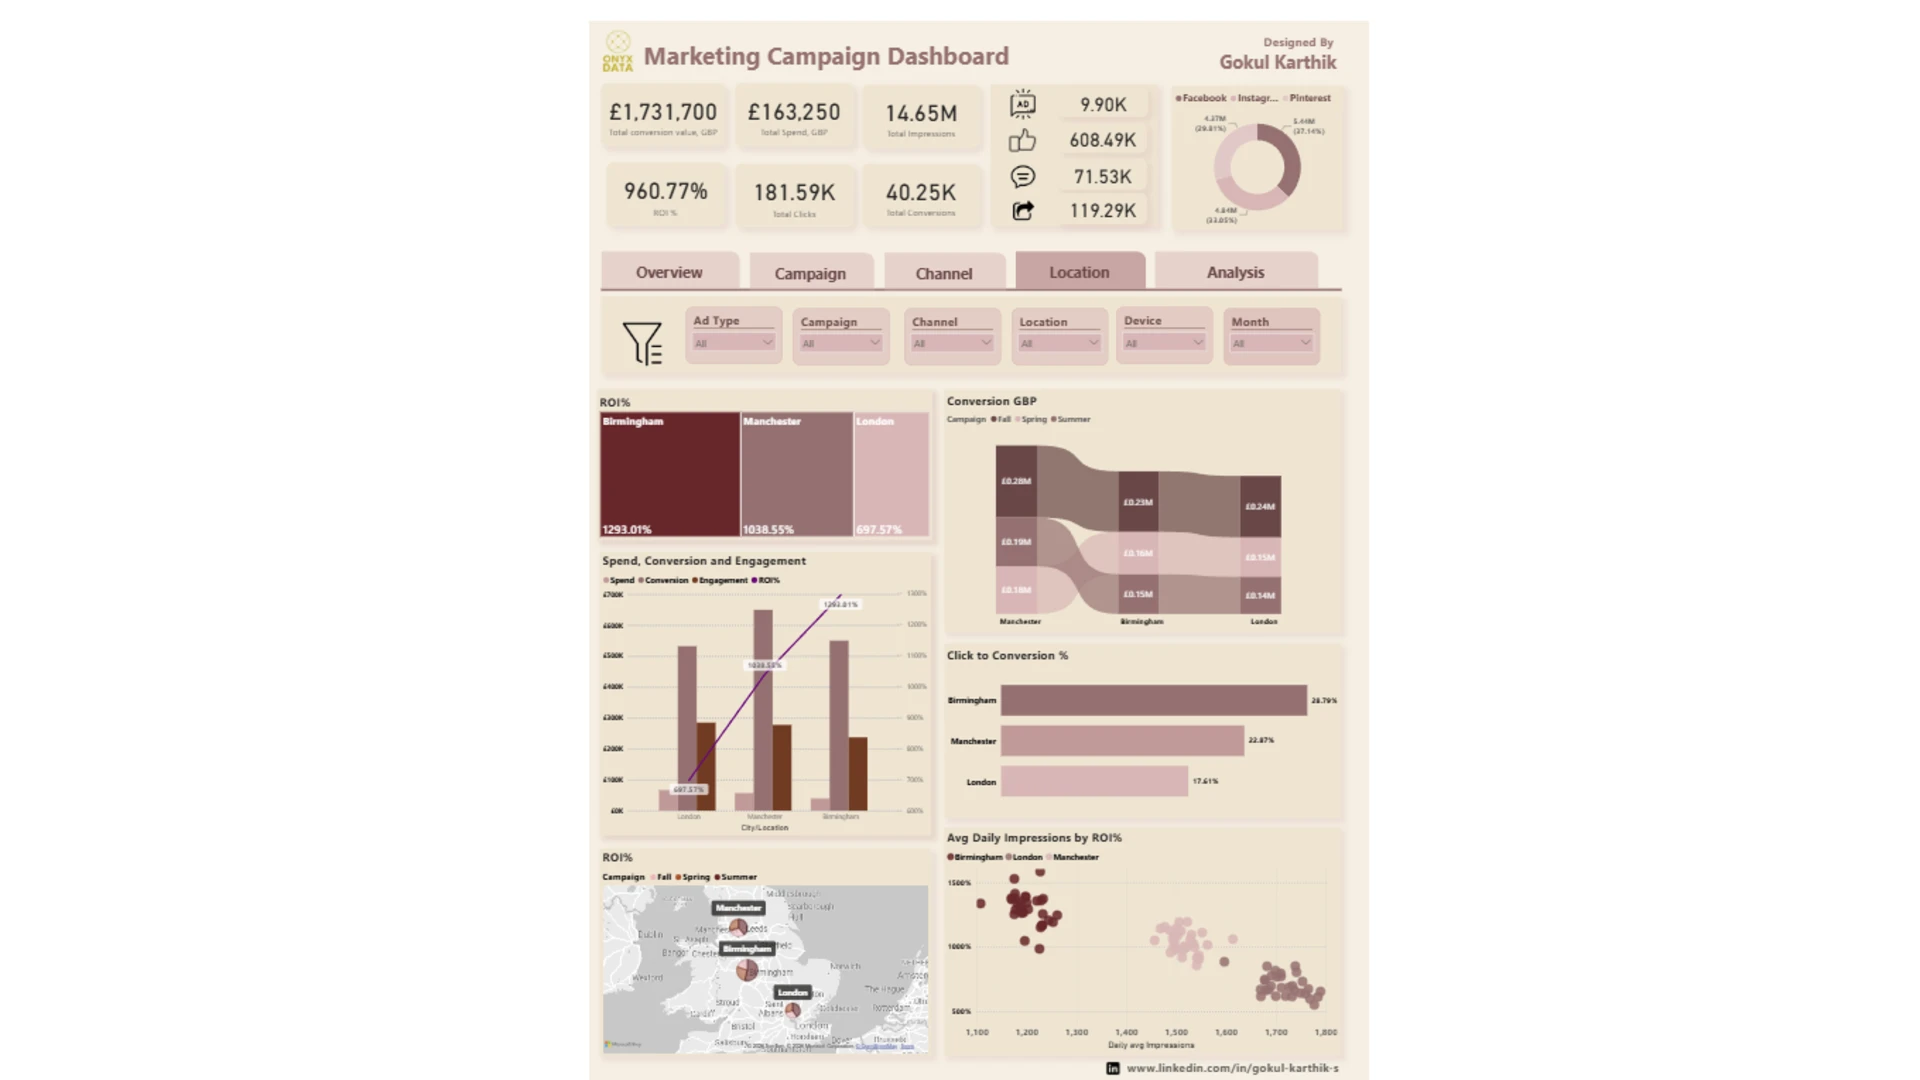
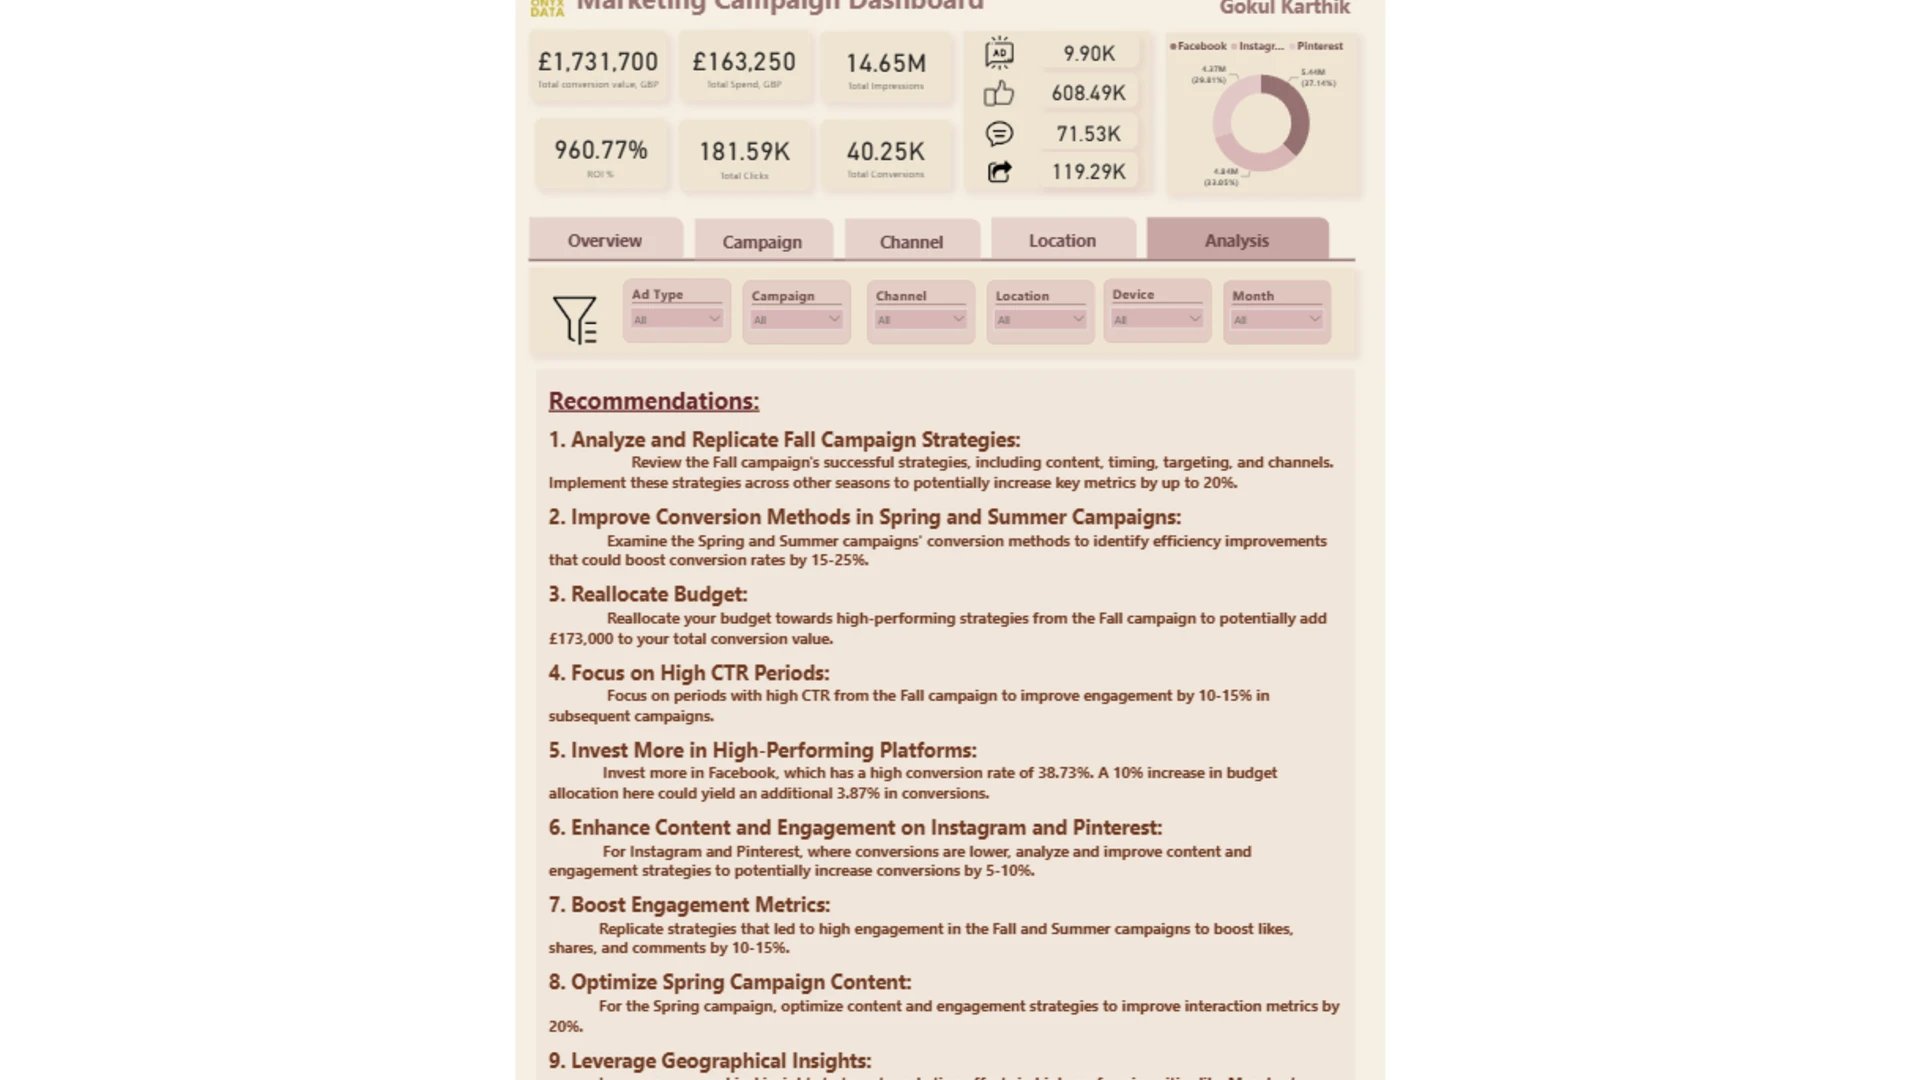
Marketing Campaign Performance Dashboard
More Report pages
Report Author: Gokul Karthik
884
Share template with others
Explore a Power BI marketing campaign dashboard for analyzing campaign performance across spend, impressions, clicks, conversions, CTR, ROAS, engagement, channels, seasons, and locations. This report helps marketing teams compare Spring, Summer, and Fall campaign results, evaluate performance by Facebook, Instagram, and Pinterest, review geographic differences, and identify which campaigns, channels, and time periods contributed most to conversion value.
4U Report Challenges
Participate in data challenges, build and submit reports to get free template downloads.
Join CommunityMobile view allows you to interact with the report. To Download the template please switch to desktop view.
Was this helpful? Thank you for your feedback!
Sorry about that.
How can we improve it?