495
Marketing Campaign Analysis 26
Marketing Campaign Analysis 26
Report Author: Sai Krishna Tummidi
495
Share template with others
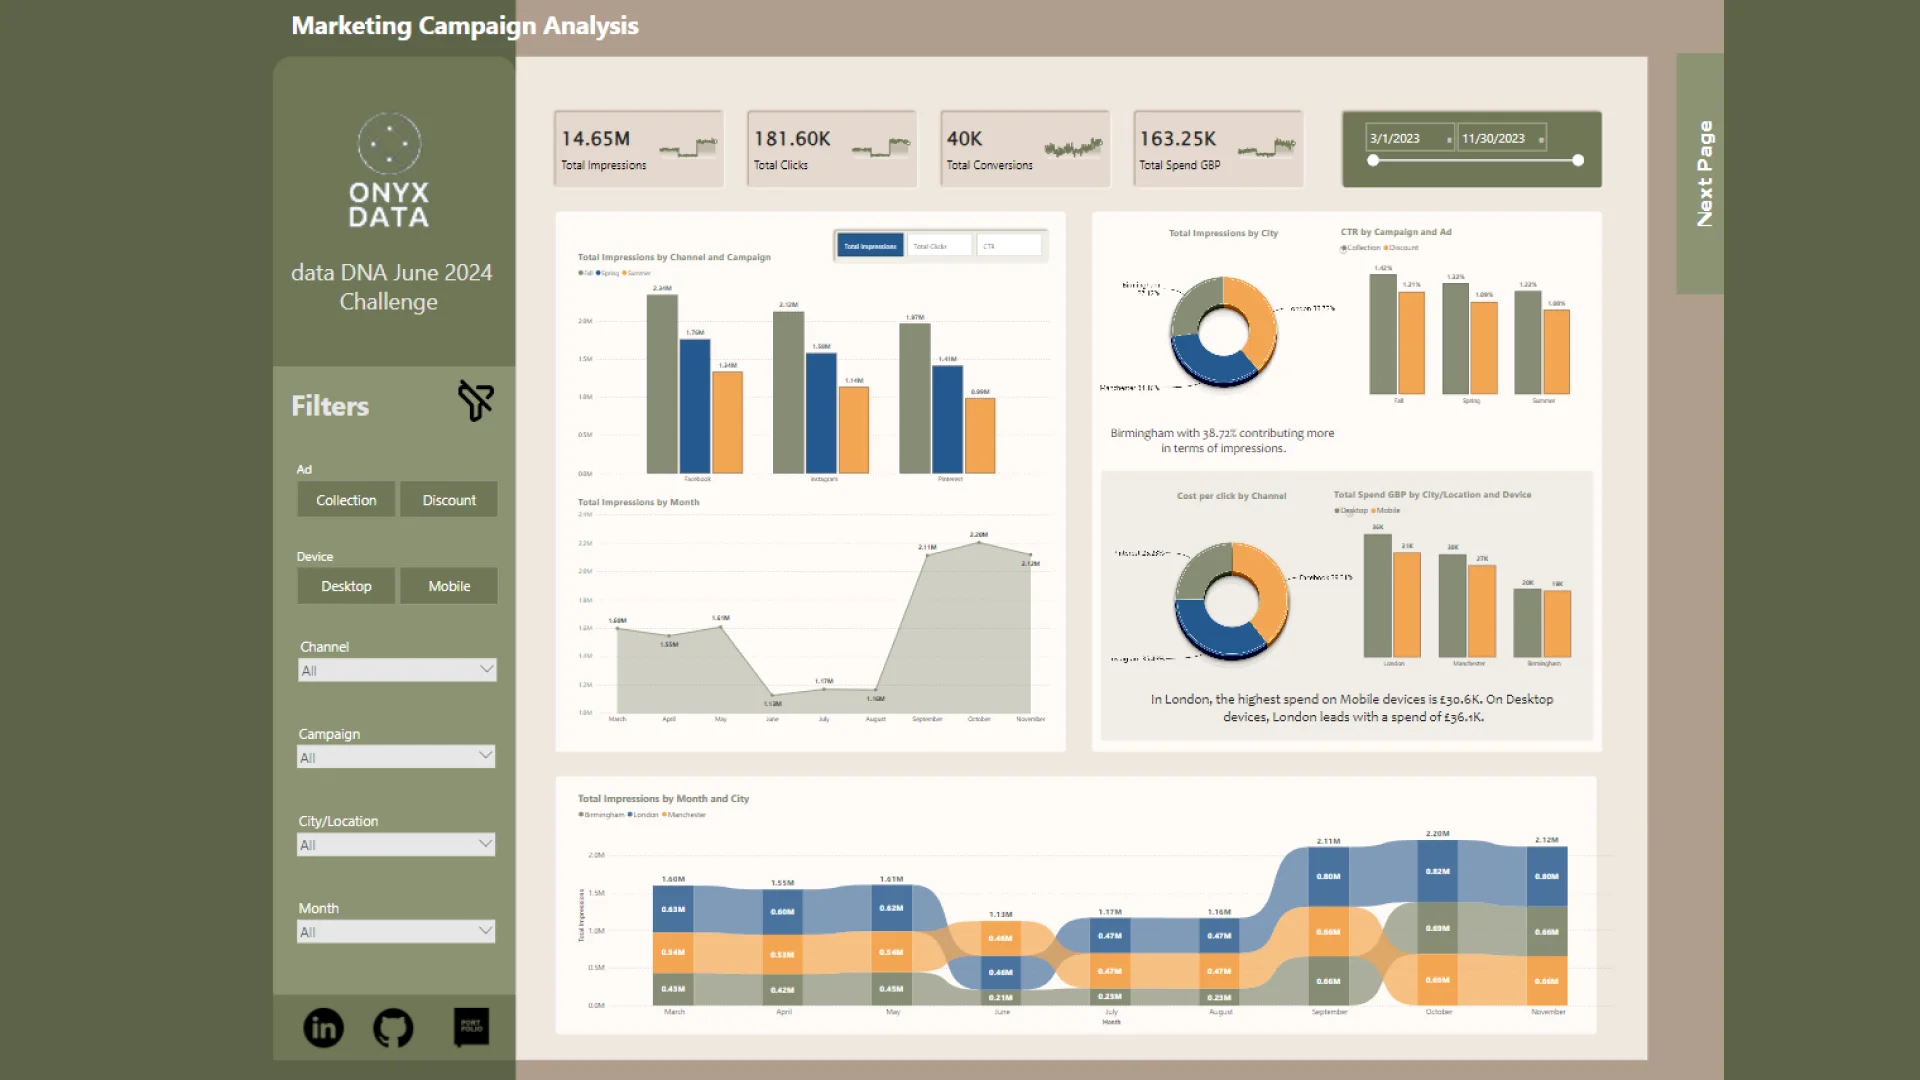
Report submitted for OnyxData #DataDNA and ZoomCharts Challenge June 2024. The report was built with the Marketing Campaing Dataset and includes ZoomCharts custom Drill Down PRO visuals for Power BI.
Author's description:
This project is part of the Onyx Data June 2024 challenge. While working on it, I acquired and utilized several skills and techniques. I performed various data cleaning and transformation steps, such as changing data types and renaming columns for better readability. I created multiple measures and calculated columns to conduct in-depth data analysis, including total impressions, total clicks, and total conversions. Additionally, I generated measures for sparklines, which I integrated into the card visual, and measures for dynamic titles.
4U Report Challenges
Participate in data challenges, build and submit reports to get free template downloads.
Join CommunityMobile view allows you to interact with the report. To Download the template please switch to desktop view.
Was this helpful? Thank you for your feedback!
Sorry about that.
How can we improve it?