391
Legal Workload Distribution Power BI Dashboard
Legal Workload Distribution Power BI Dashboard
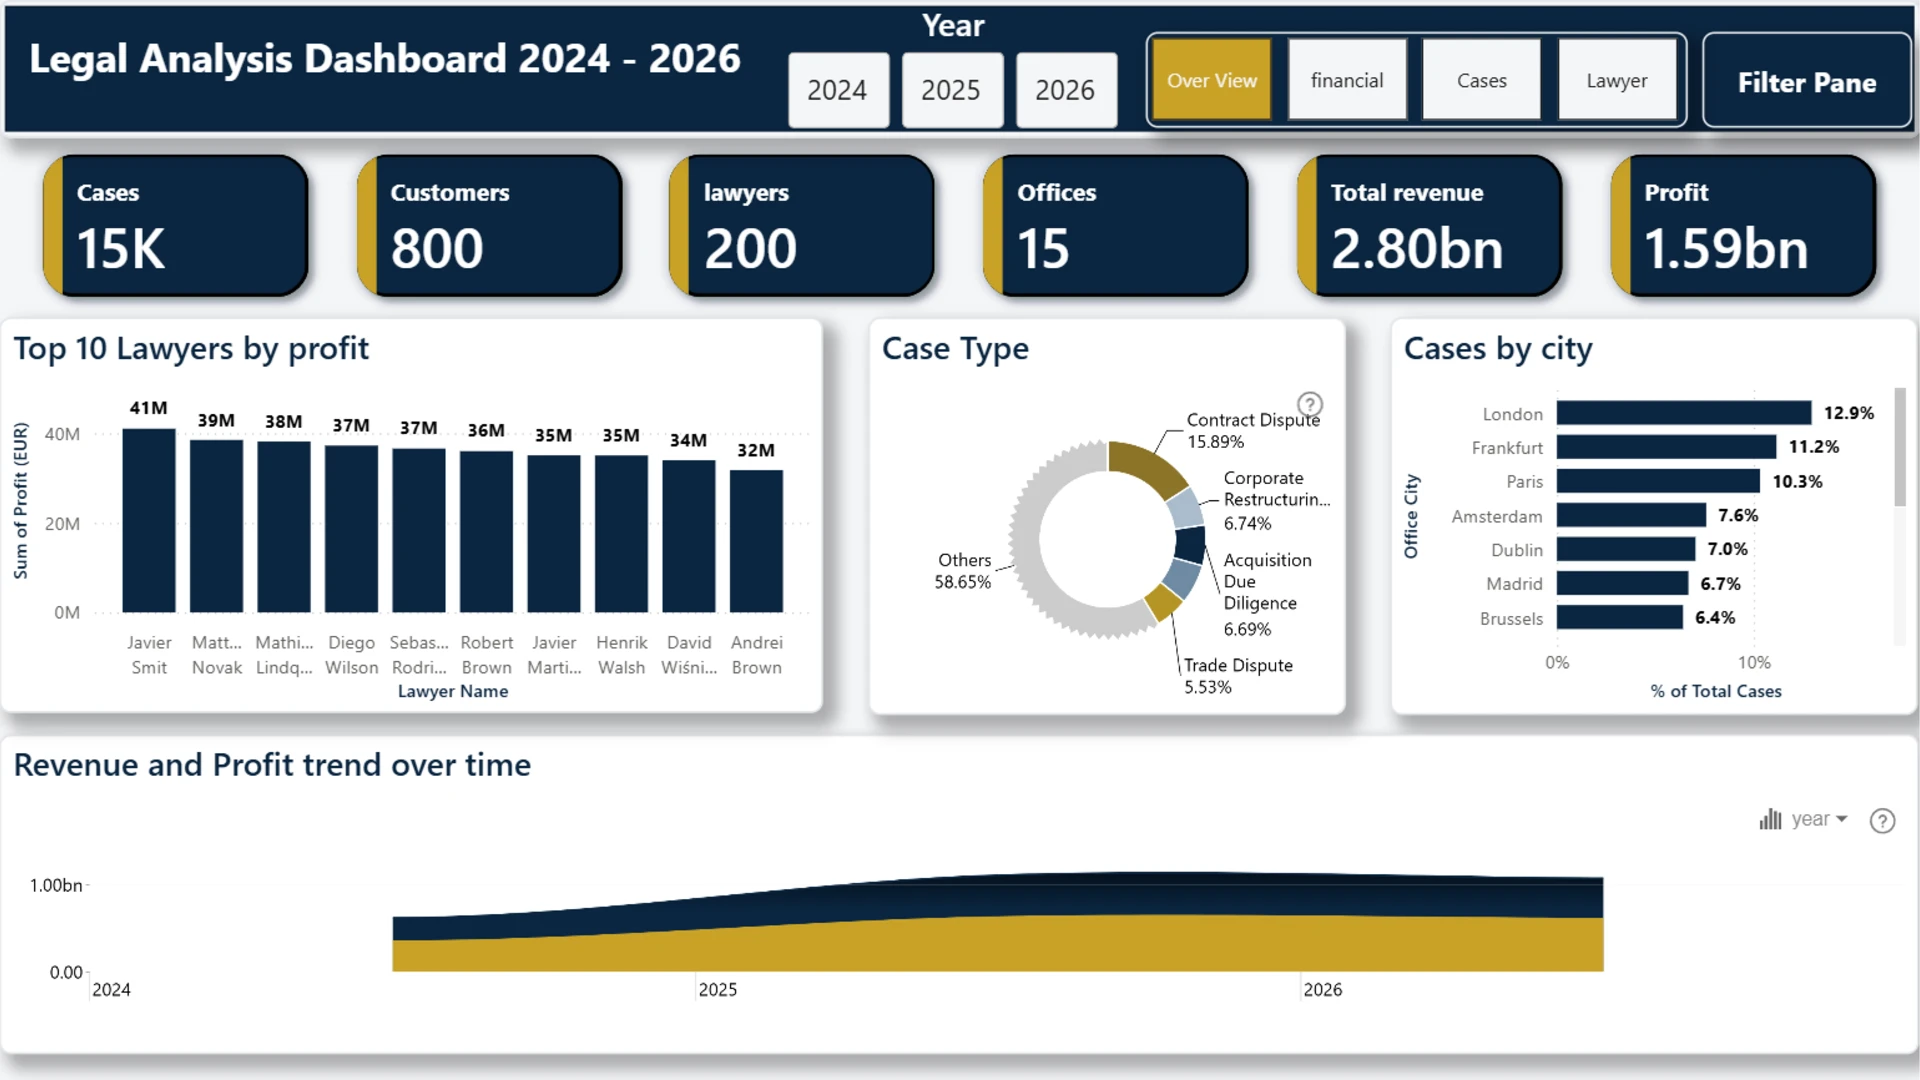
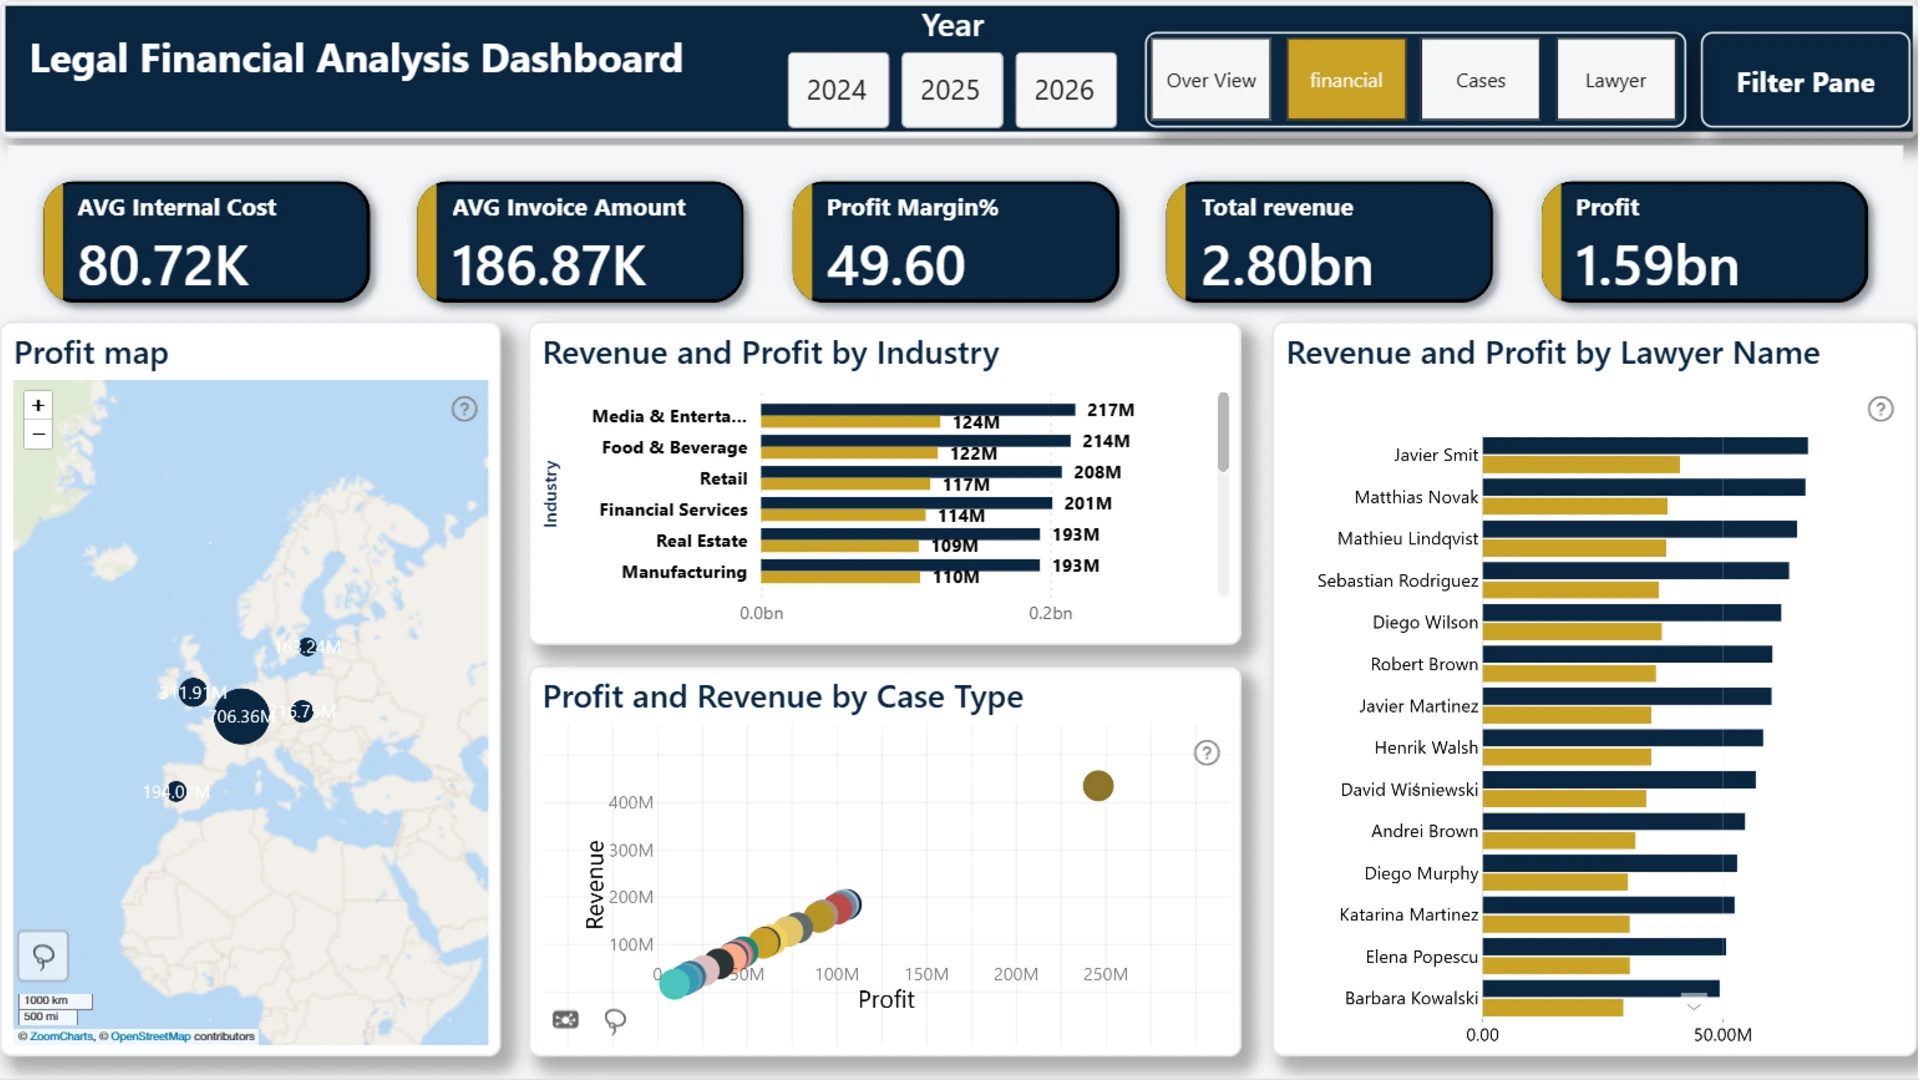
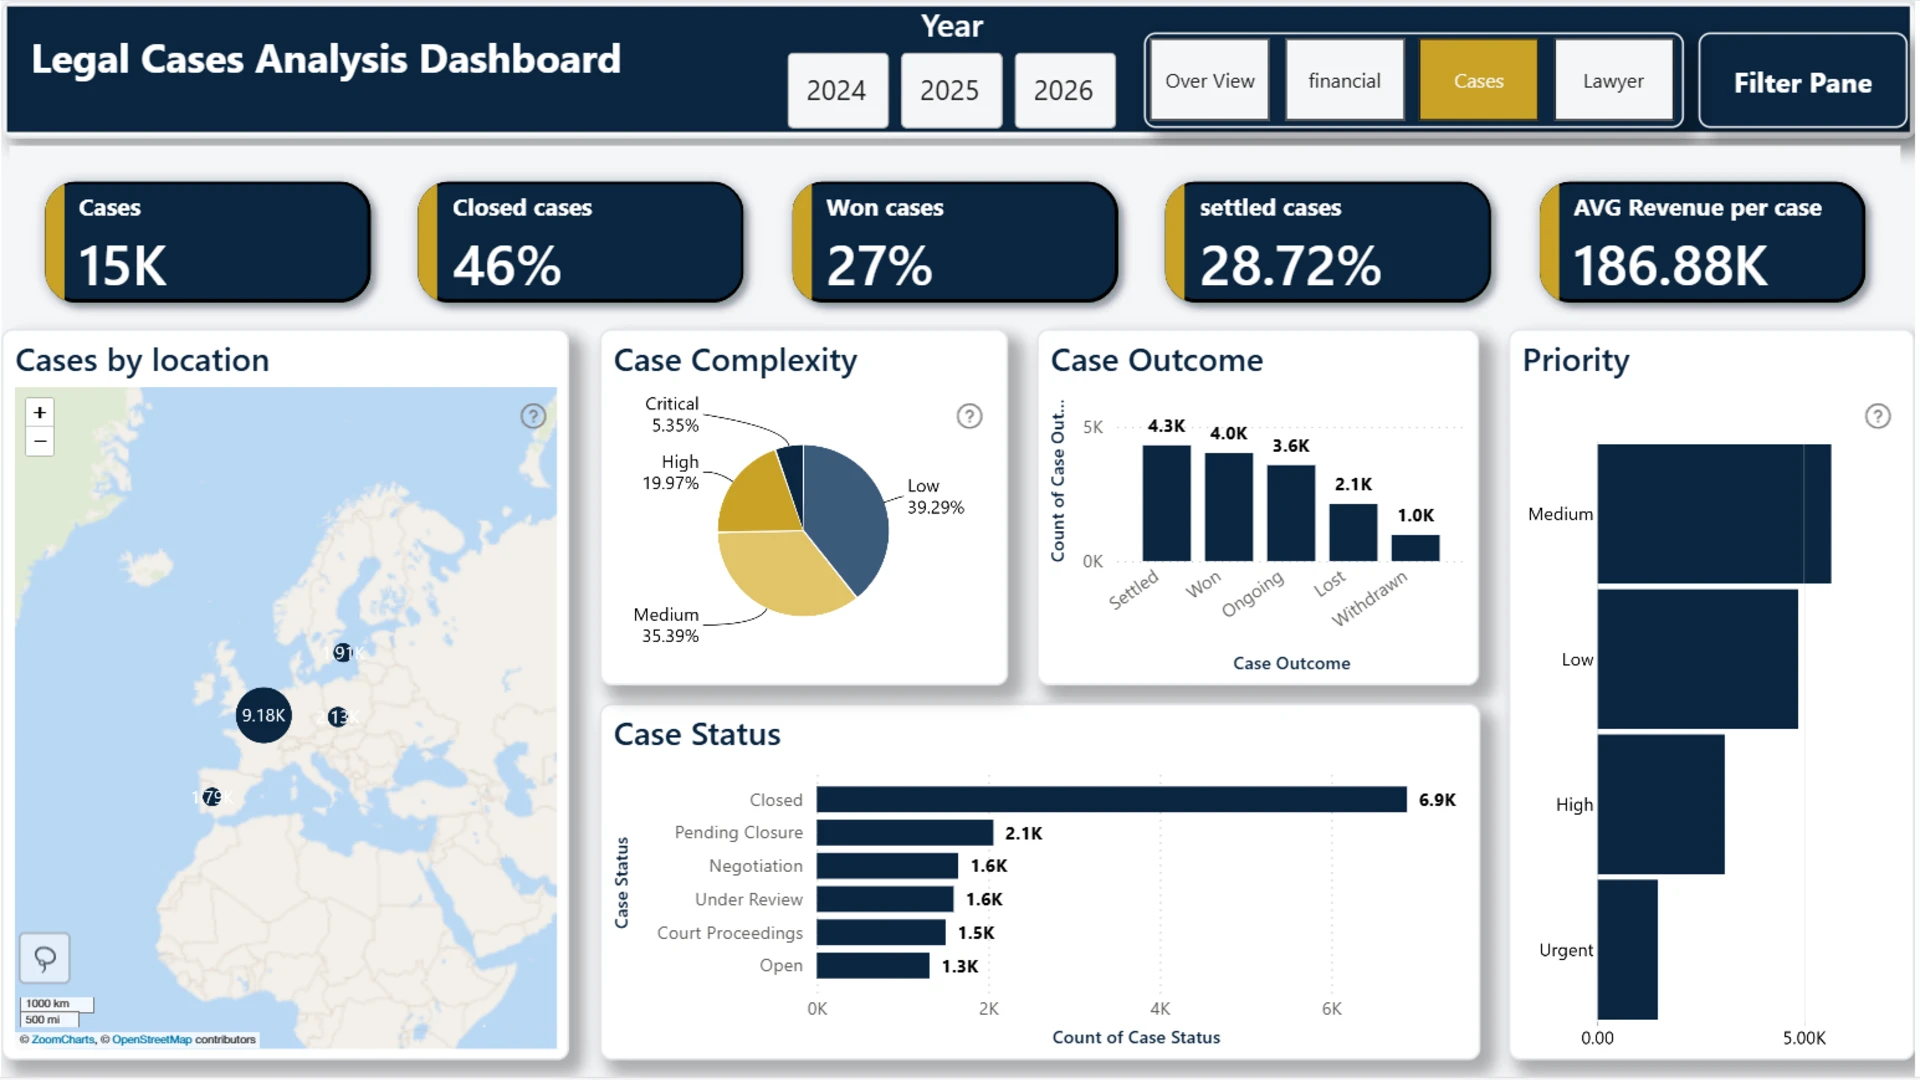
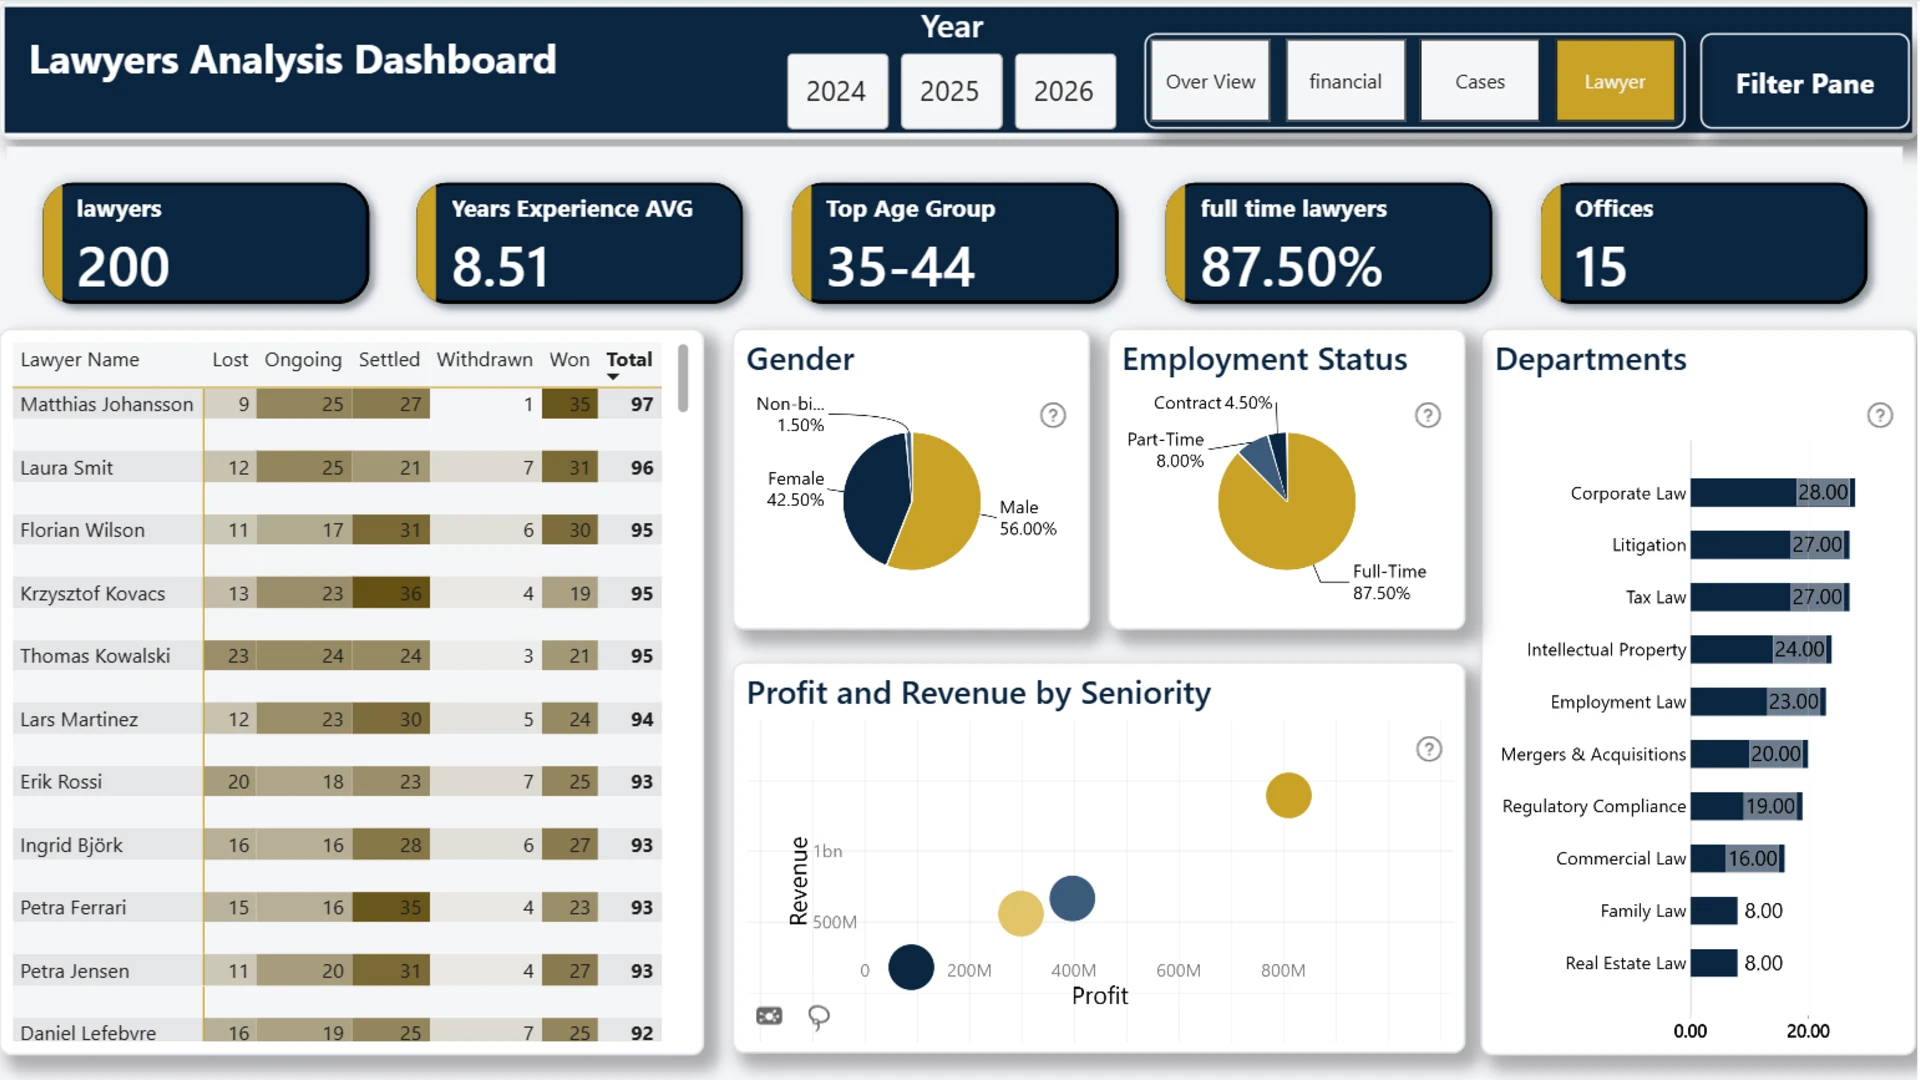
More Report pages
Report Author: Youssef Abdelhamed
391
Share template with others
Analyze legal workload distribution in Power BI across lawyers, departments, offices, case complexity, duration, outcomes, risk, and profitability.
Author’s Description:
Legal Analytics Dashboard is a 4-page Power BI report designed for a multi-office international law firm, covering case operations, financial performance, and lawyer productivity. Built on a star-schema data model with custom DAX measures, it tracks key metrics like win rate, profit margin, outstanding balance, and lawyer utilization, all styled with a custom navy & gold theme reflecting the legal industry. The Cases page leverages ZoomCharts Drill Down Map and Bar Chart PRO visuals for interactive geographic and category-level exploration of 15K+ case records.
ZoomCharts visuals used






4U Report Challenges
Participate in data challenges, build and submit reports to get free template downloads.
Join CommunityMobile view allows you to interact with the report. To Download the template please switch to desktop view.
How to use a PBIX template
Preview the interactive report, download the PBIX file, open it in Power BI Desktop, and replace the same data connection with your own dataset.
Preview and download
Explore the report online and download the PBIX template file.
Open in Power BI Desktop
Open the downloaded PBIX file in Power BI Desktop.
Connect your data
Replace the sample data source with your own dataset.
Refresh and adjust
Refresh the model and update fields or visual were needed.
Save and share
Save your report and publish it for your audience.


