1955
Law Firm Profitability by Practice Area Power BI Dashboard
Law Firm Profitability by Practice Area Power BI Dashboard
More Report pages
Report Author: Ugo Ndu
1955
Share template with others
Summary
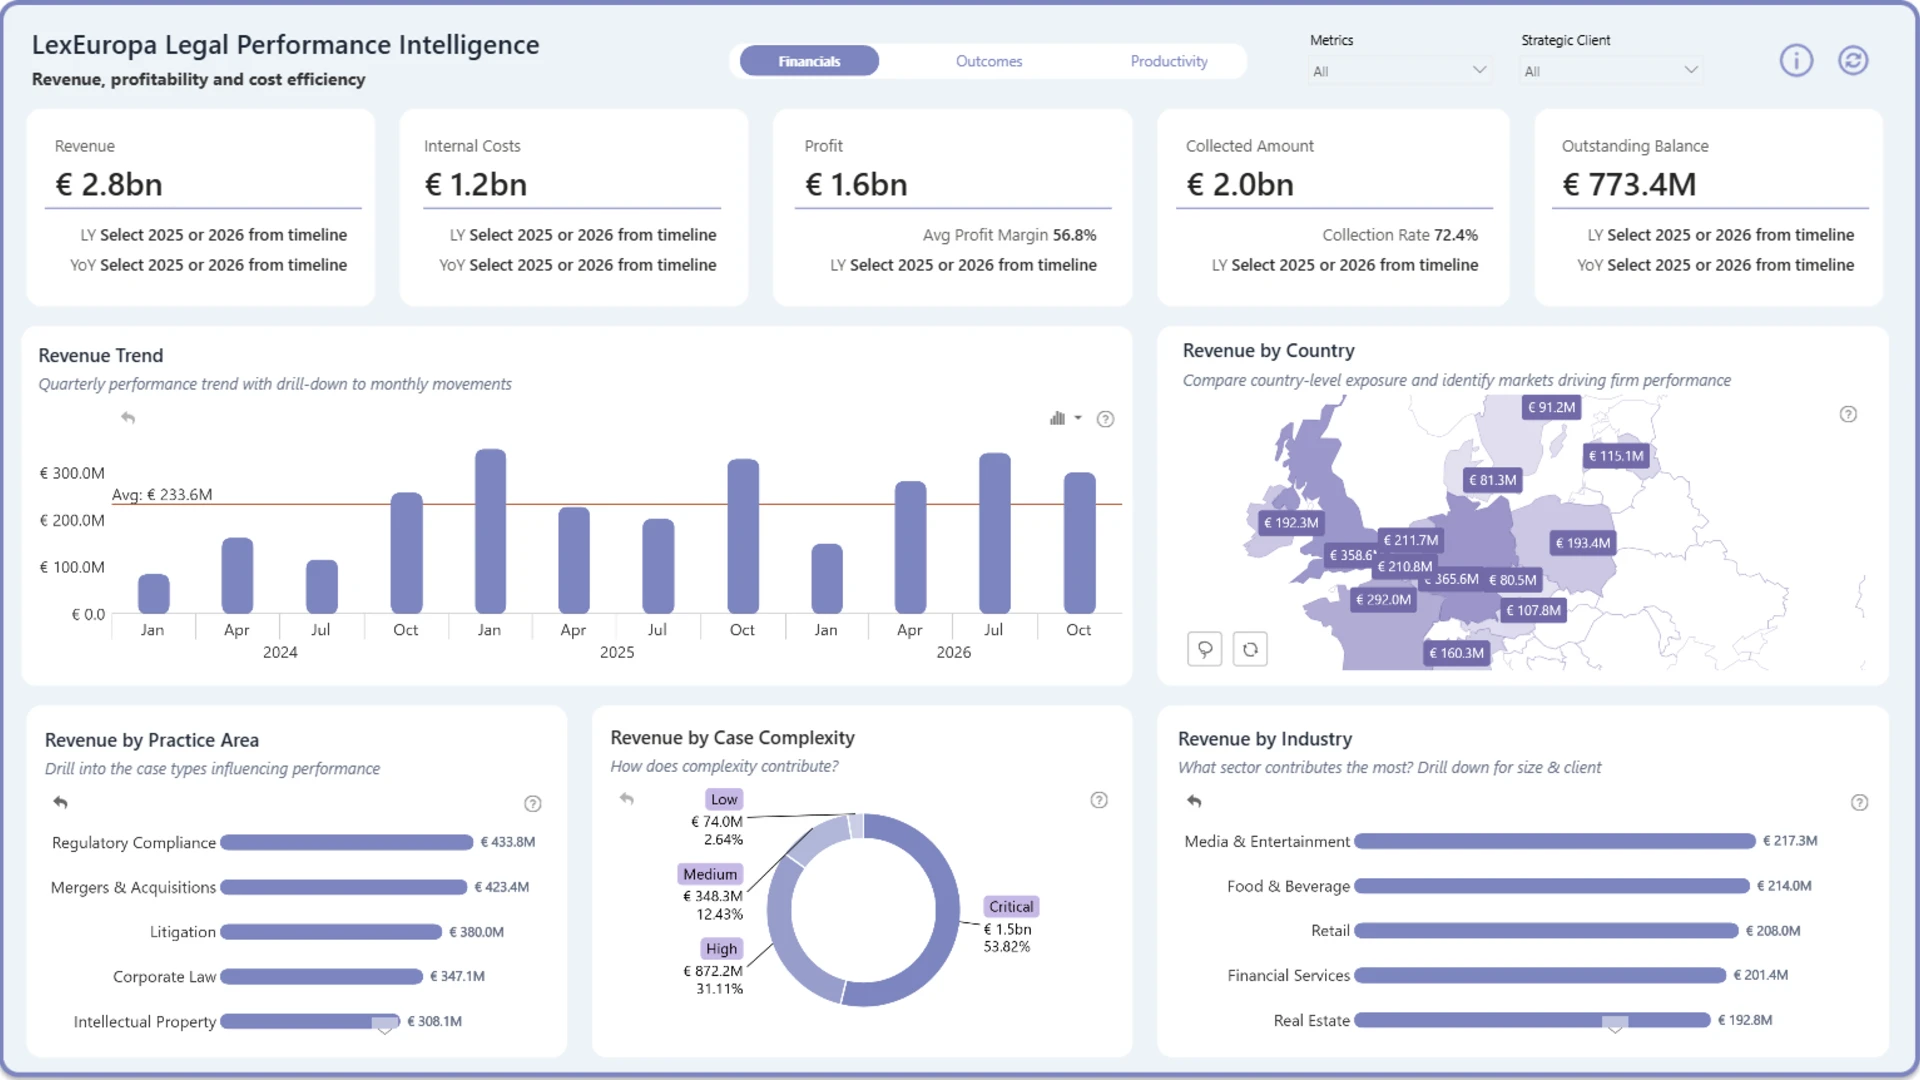
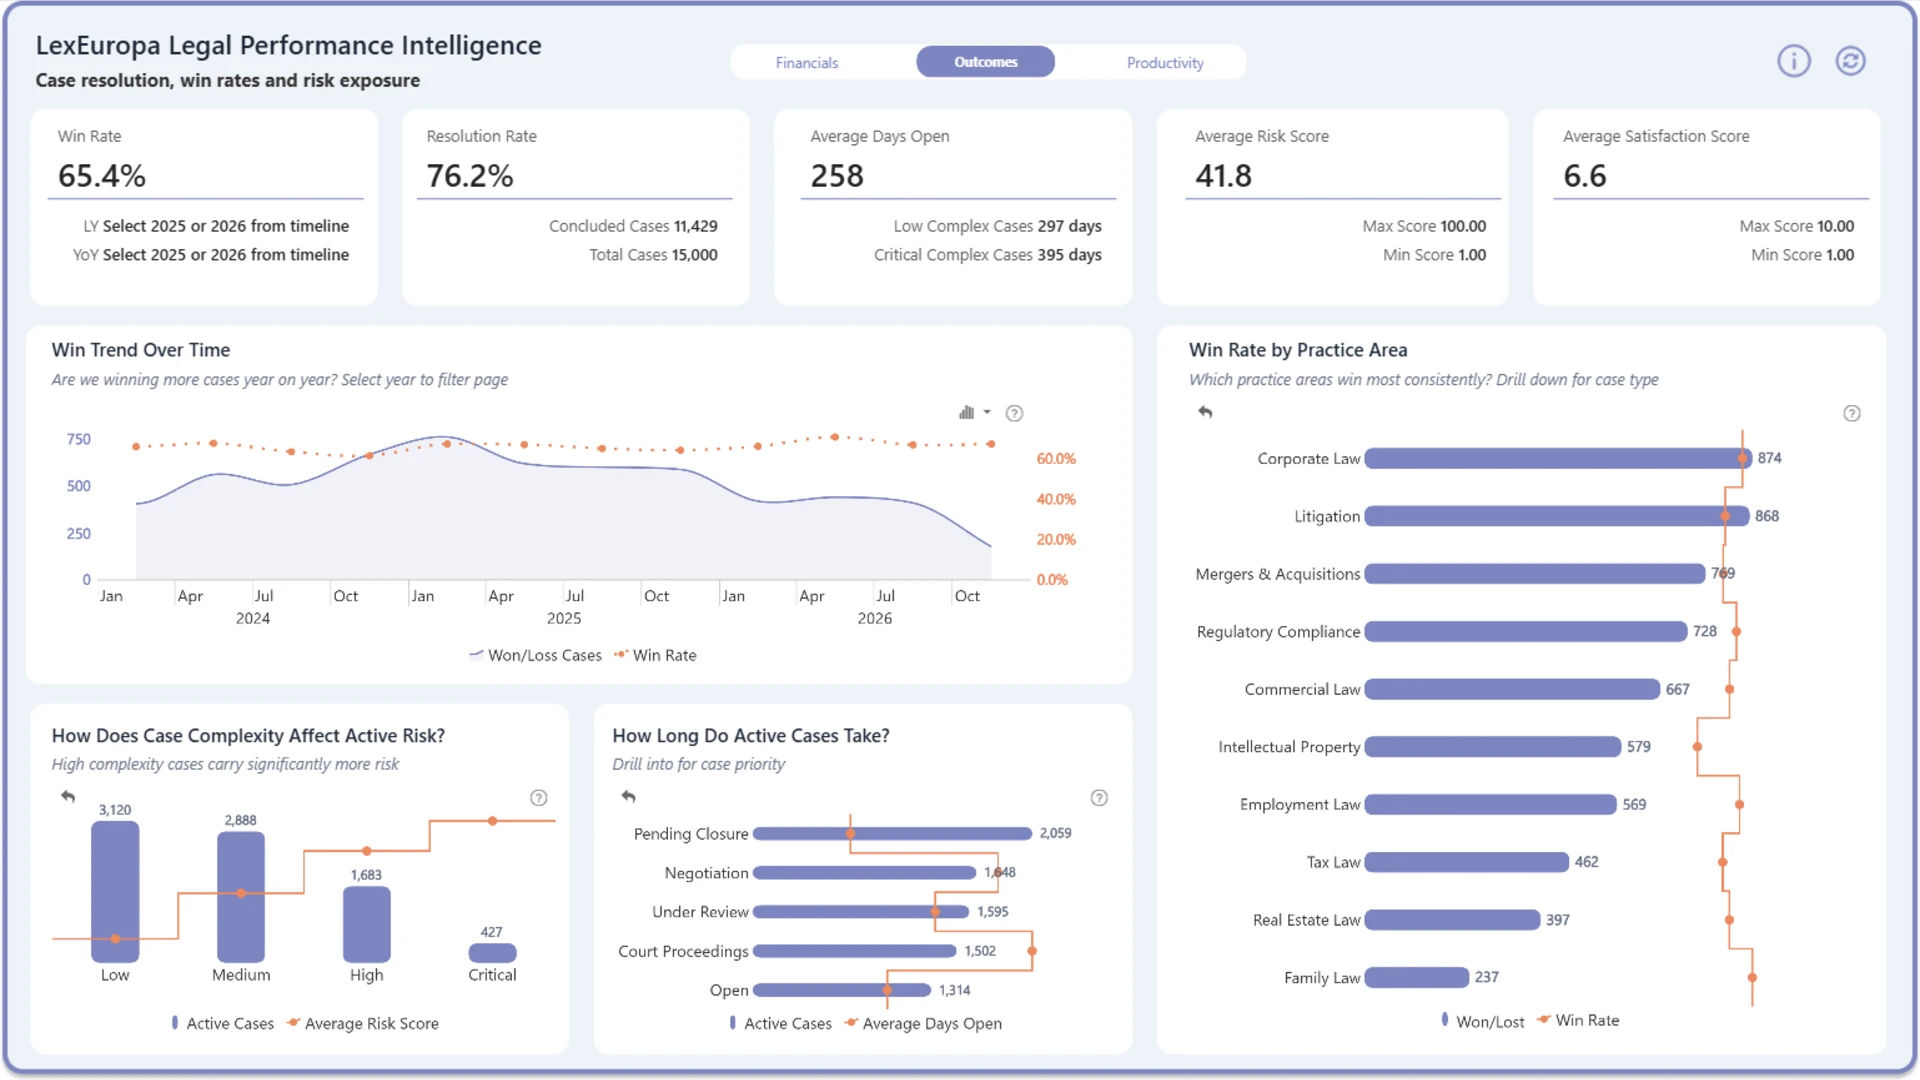
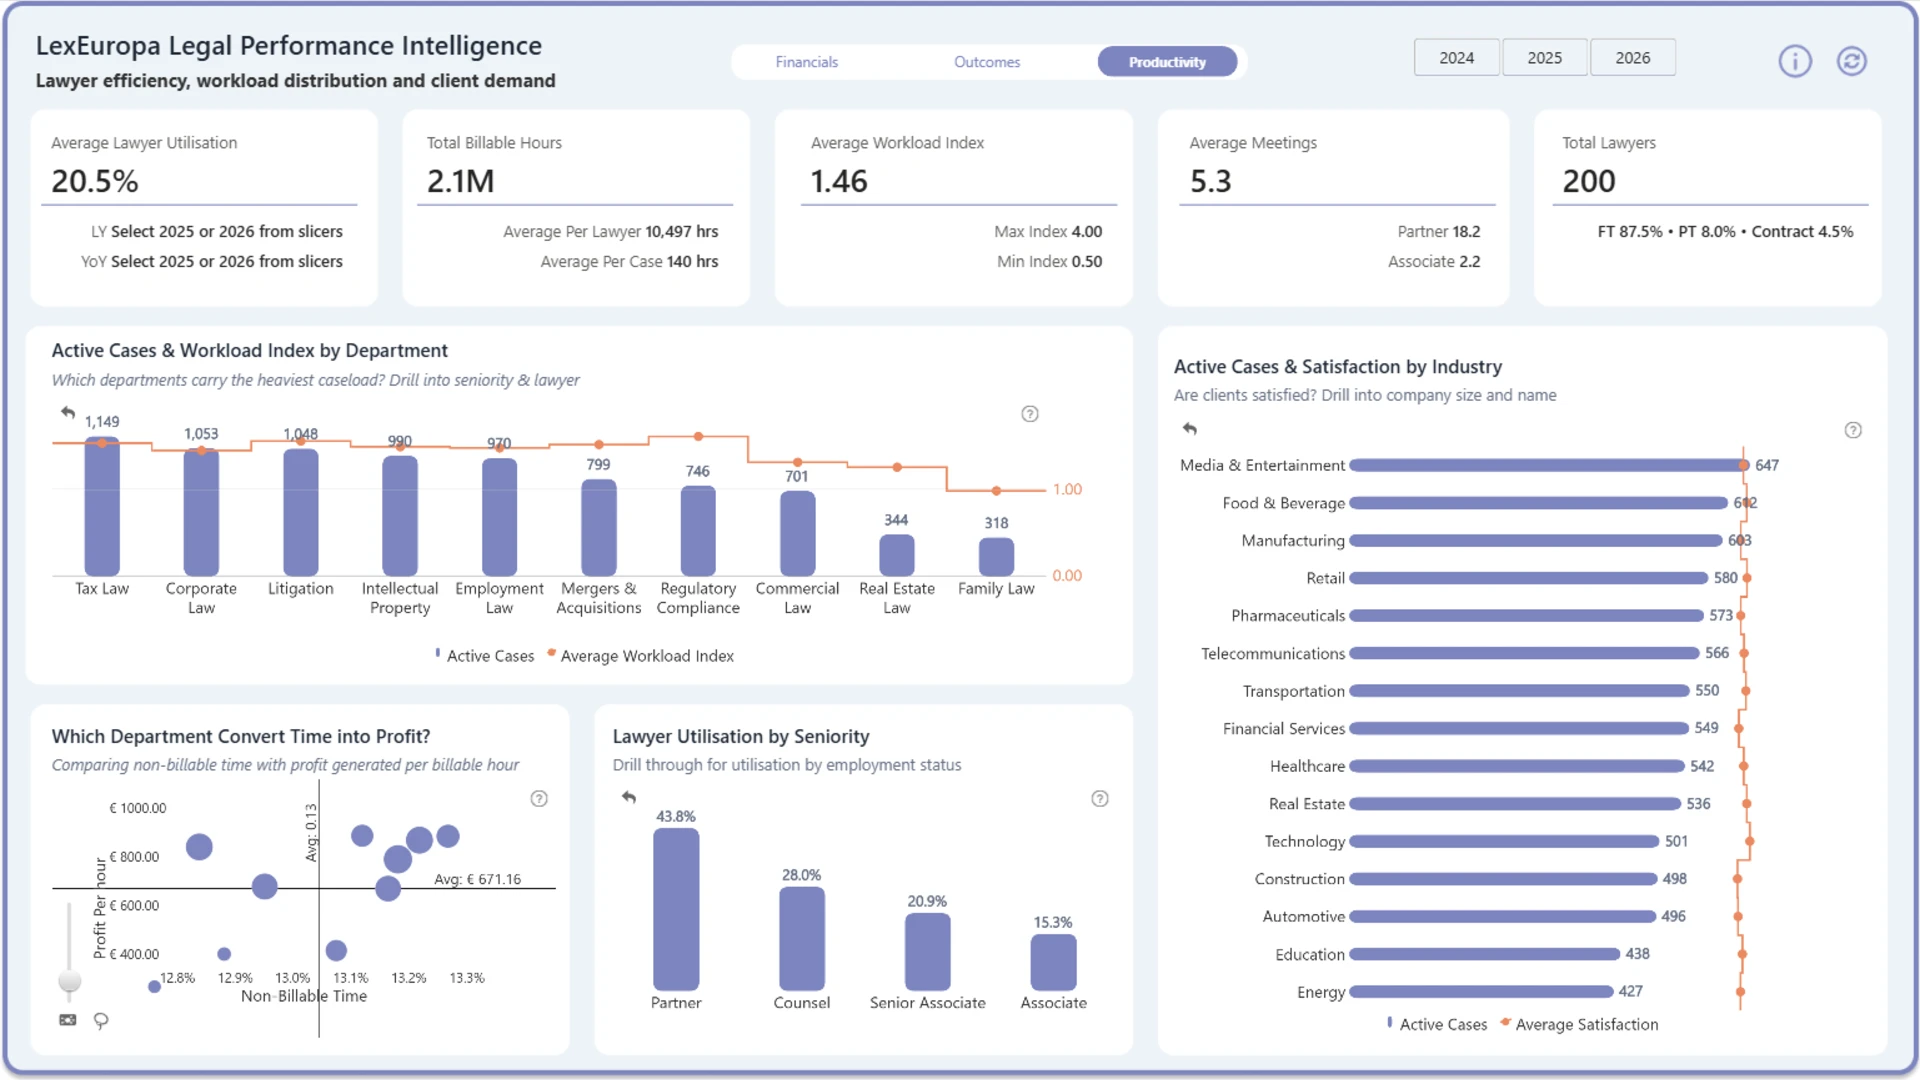
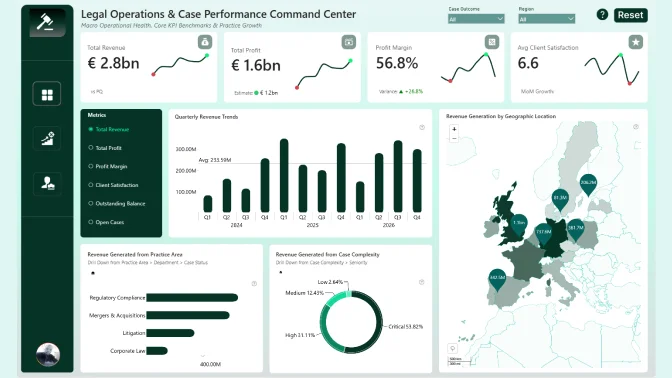
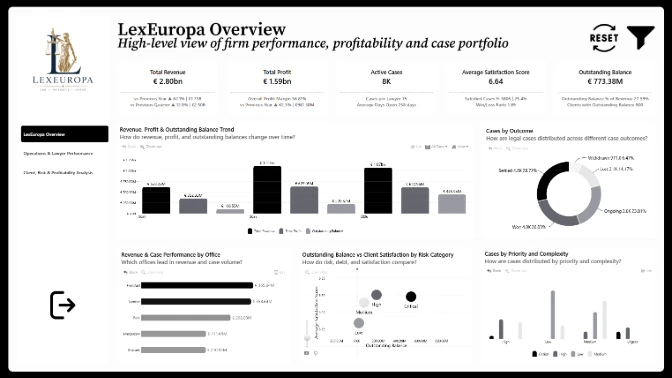
This Power BI law firm profitability dashboard helps legal operations teams, finance leaders, and managing partners compare financial performance across practice areas. It brings revenue, profit, and profit margin analysis into an interactive view that makes it easier to identify which areas contribute most to firm performance.
Key Insights of the Law Firm Profitability by Practice Area Dashboard
The dashboard provides a focused view of legal financial performance. Key insights include:
- Practice area profitability: Compare revenue and profit across different types of legal work.
- Profit margins: Assess how effectively each practice area converts revenue into profit.
- Financial trends: Explore changes in revenue and profitability over time.
- Performance comparison: Identify stronger-performing practice areas and areas that may require closer review.
Interactive Power BI visuals help users move from firm-level results to more detailed practice area analysis. Selecting active chart elements filters the related data, making it easier to compare financial results from different perspectives.
How to Use This Law Firm Profitability by Practice Area Dashboard
Use the available filters and click active elements directly within the charts to explore revenue, profit, and profit margin by practice area. Drill into individual categories to investigate the factors behind overall financial performance.
Download the .pbix file to review the report settings, formulas, and calculations, or customize the dashboard for your own law firm and legal operations data.
ZoomCharts visuals used






4U Report Challenges
Participate in data challenges, build and submit reports to get free template downloads.
Join CommunityMobile view allows you to interact with the report. To Download the template please switch to desktop view.
How to use a PBIX template
Preview the interactive report, download the PBIX file, open it in Power BI Desktop, and replace the same data connection with your own dataset.
Preview and download
Explore the report online and download the PBIX template file.
Open in Power BI Desktop
Open the downloaded PBIX file in Power BI Desktop.
Connect your data
Replace the sample data source with your own dataset.
Refresh and adjust
Refresh the model and update fields or visual were needed.
Save and share
Save your report and publish it for your audience.


