1299
Inventory Management Analysis 26
Inventory Management Analysis 26
More Report pages
Report Author: Ayushi Dadhich
1299
Share template with others
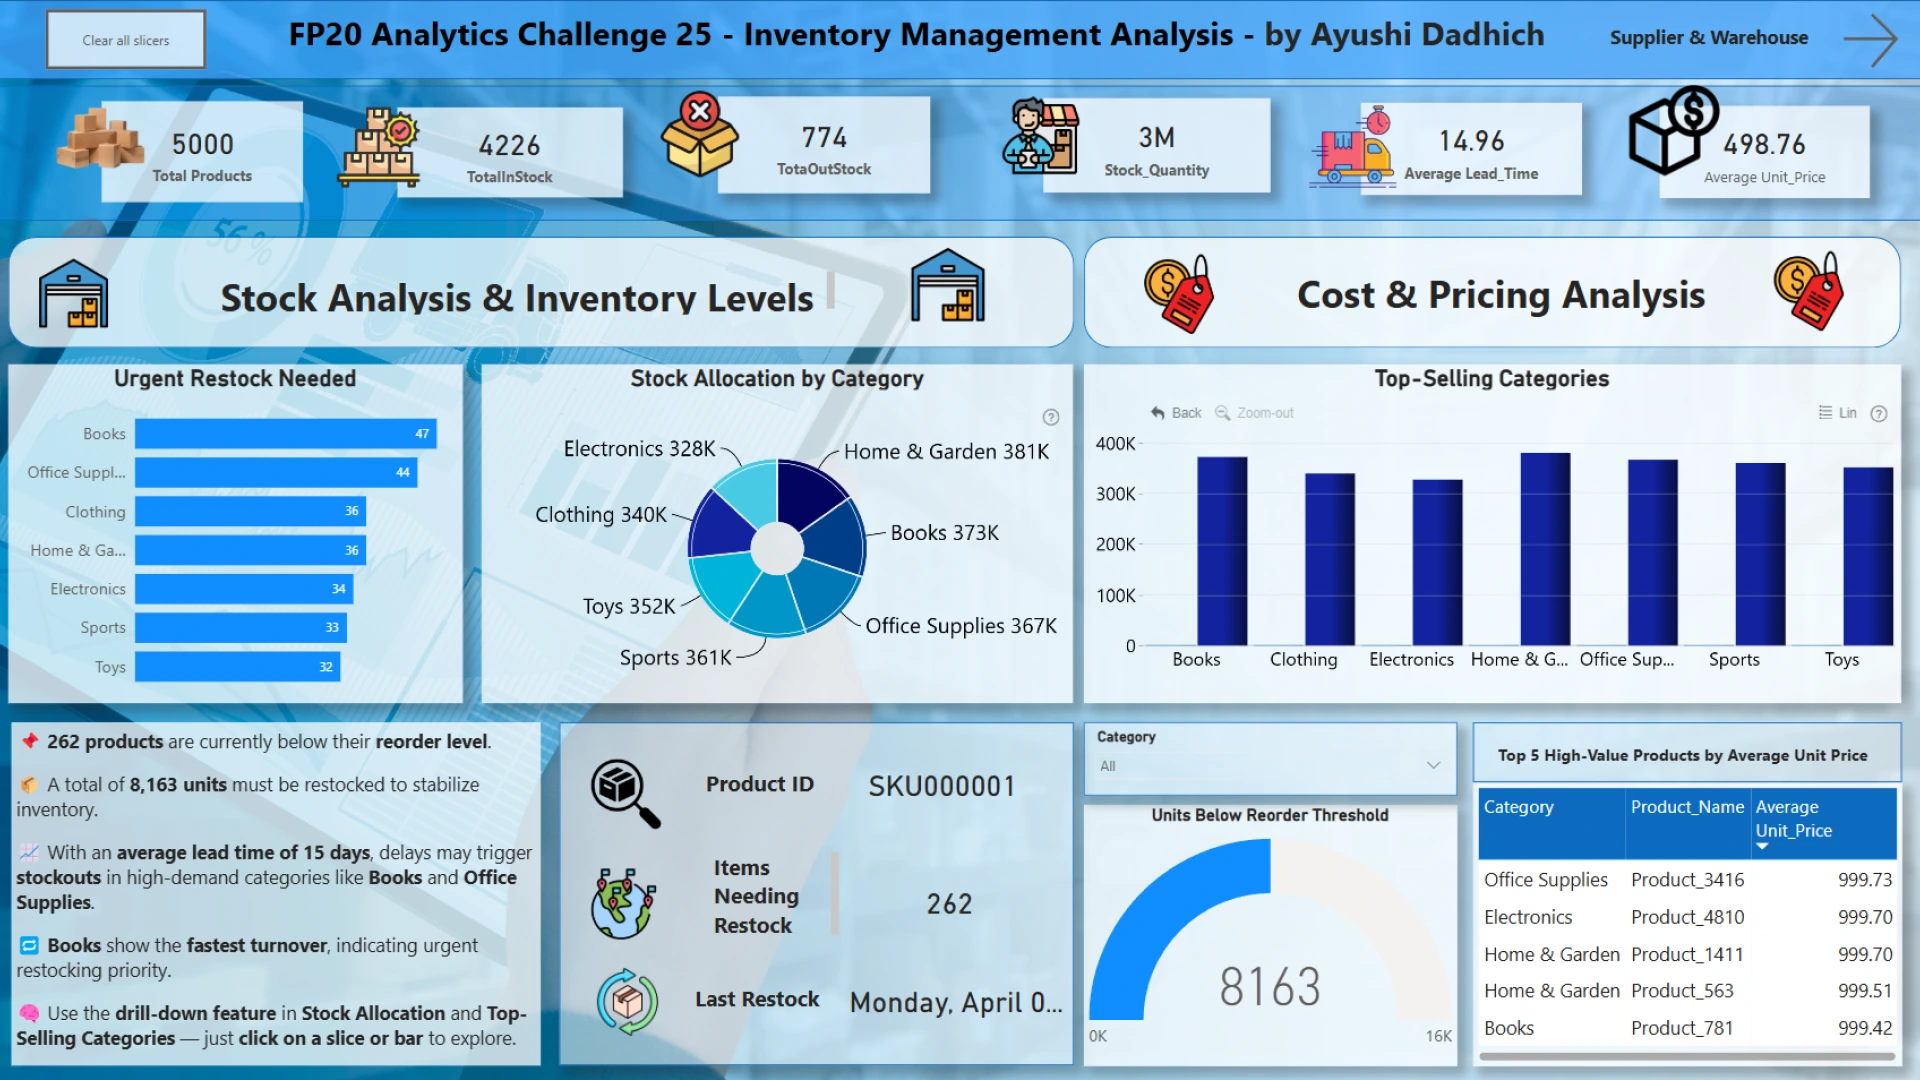
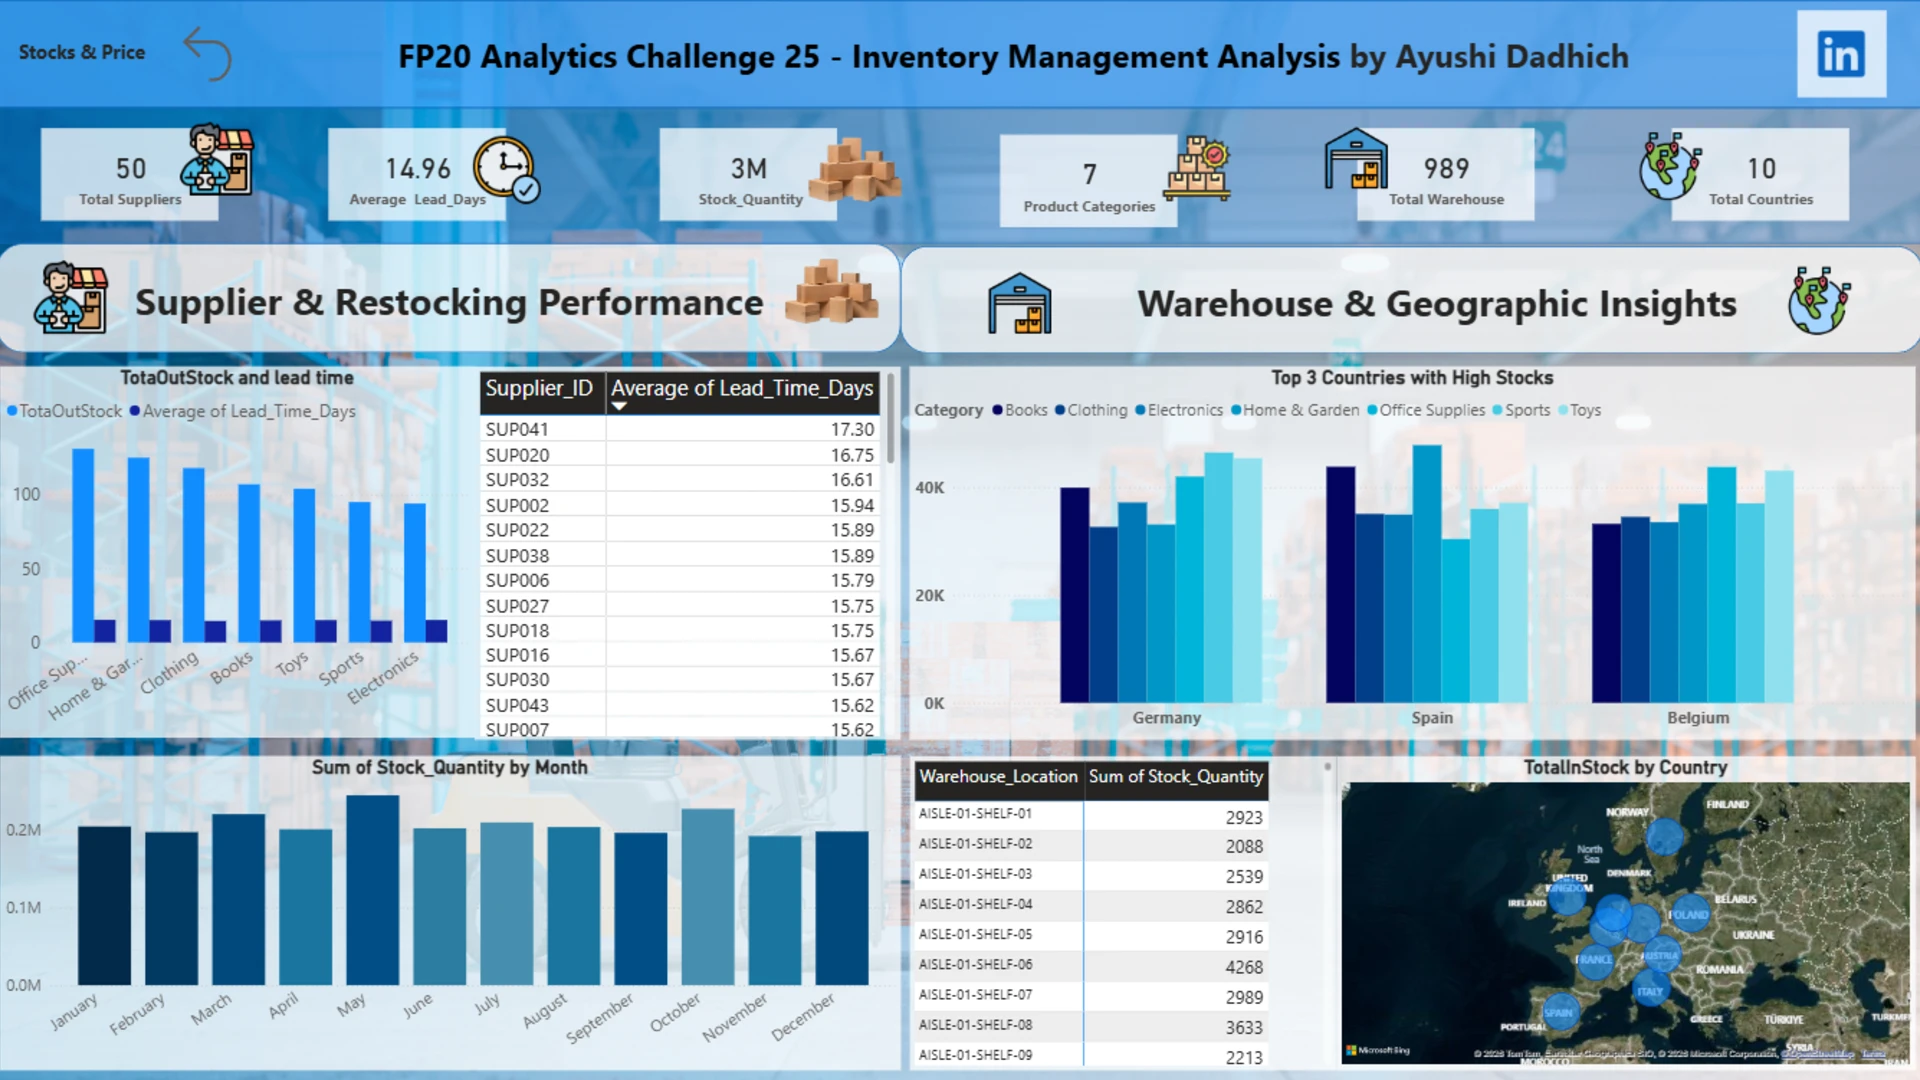
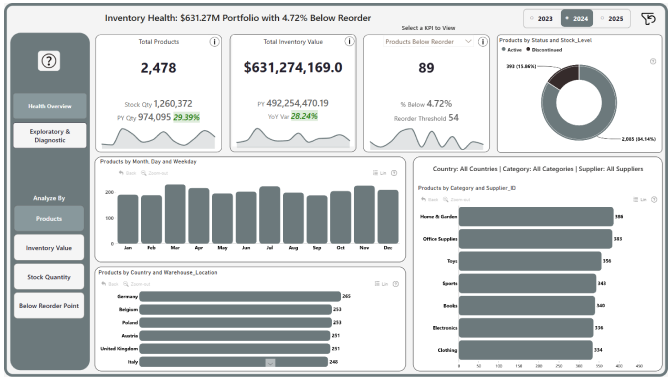
Designed an interactive, insights-driven Power BI dashboard to analyze stock levels, restocking efficiency, supplier performance, and warehouse distribution across 10 countries. Leveraged ZoomCharts visuals for dynamic drill-downs and intuitive data exploration. Key insights include reorder prioritization, average lead times, and category-level stock imbalances, enabling smarter supply chain decisions. Features: Real-time visibility into 5000+ products & 50 suppliers Strategic restocking alerts with reorder threshold tracking Geographic & monthly stock distribution mapping ZoomCharts-powered category & supplier deep dives Clean, consistent UI with guided tooltips and KPIs Outcome: Identified 262 critical products for restock and optimized supplier selection by lead time performance—empowering data-backed operational decisions.


4U Report Challenges
Participate in data challenges, build and submit reports to get free template downloads.
Join CommunityMobile view allows you to interact with the report. To Download the template please switch to desktop view.
How to use a PBIX template
Preview the interactive report, download the PBIX file, open it in Power BI Desktop, and replace the same data connection with your own dataset.
Preview and download
Explore the report online and download the PBIX template file.
Open in Power BI Desktop
Open the downloaded PBIX file in Power BI Desktop.
Connect your data
Replace the sample data source with your own dataset.
Refresh and adjust
Refresh the model and update fields or visual were needed.
Save and share
Save your report and publish it for your audience.


