179
HR Retention & Attrition Analysis Report in Power BI
HR Retention & Attrition Analysis Report in Power BI
More Report pages
Report Author: Kenneth Amobi
179
Share template with others
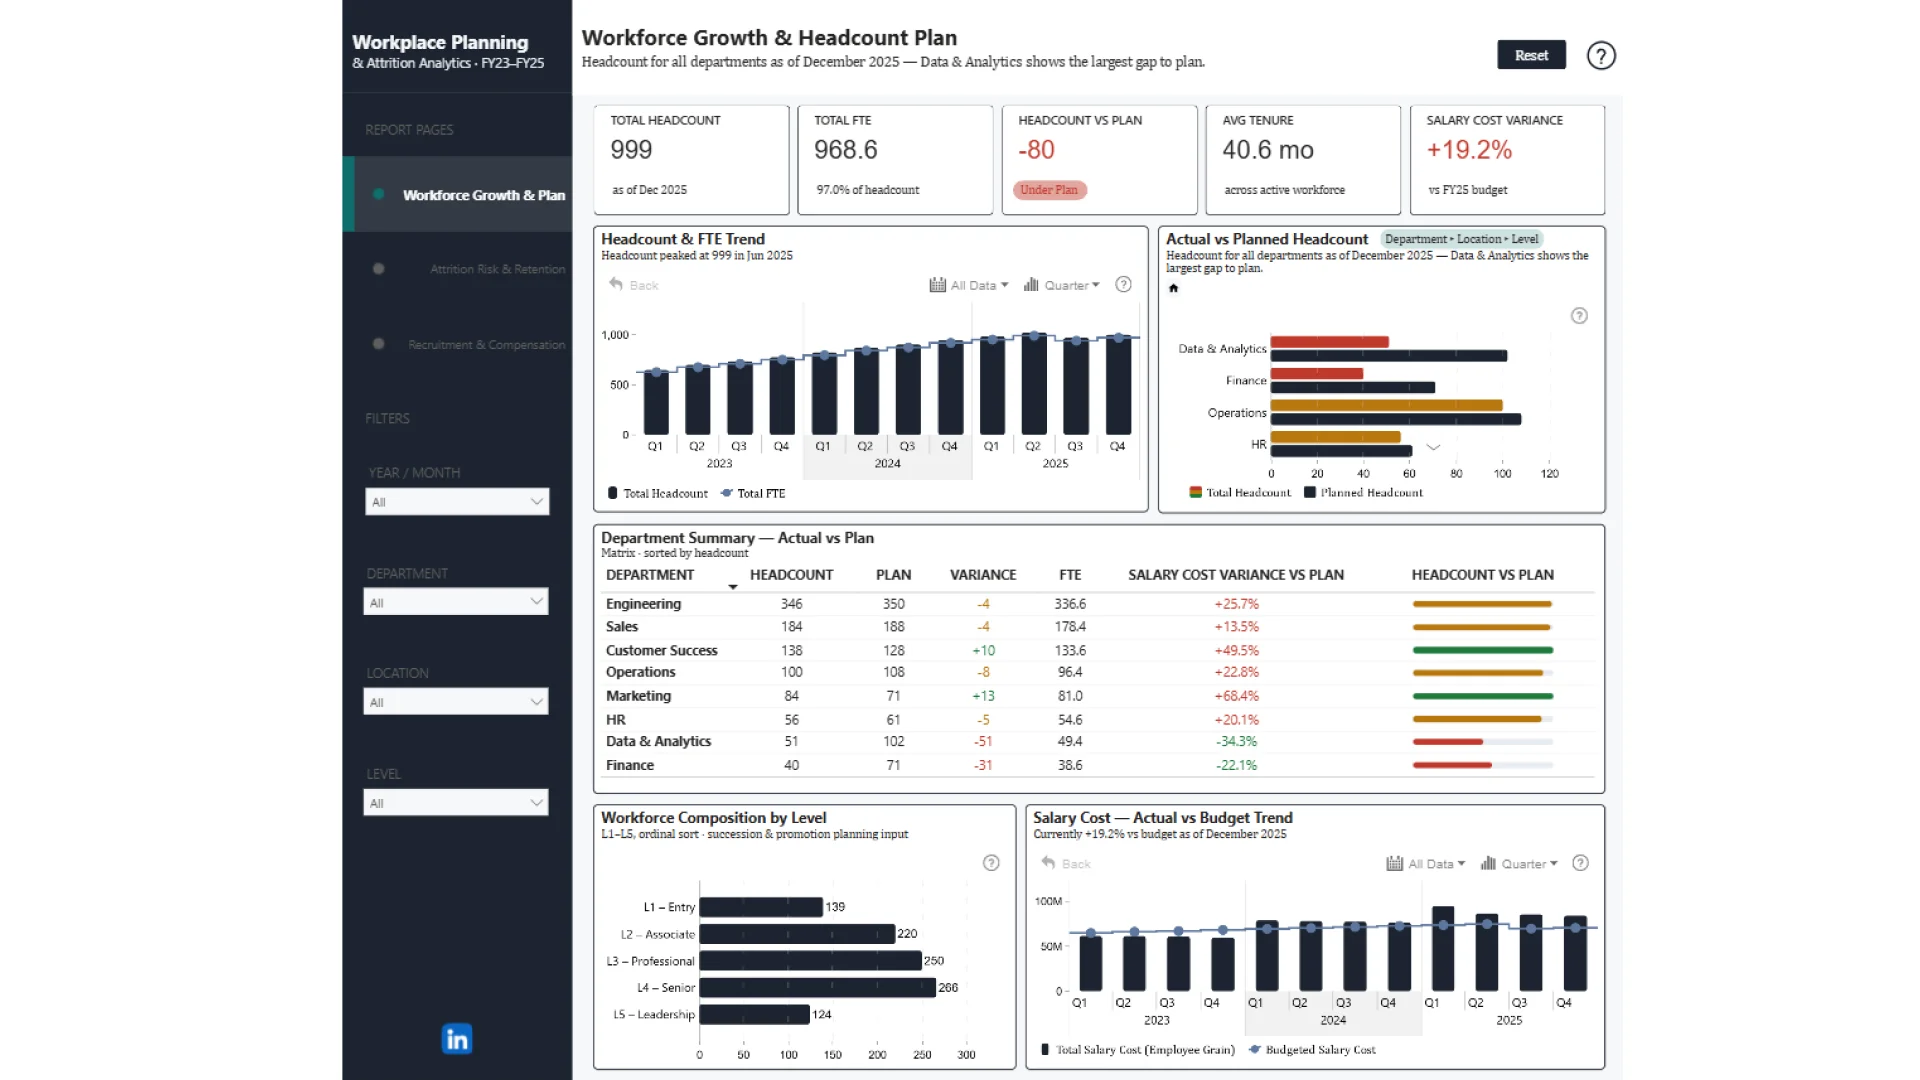
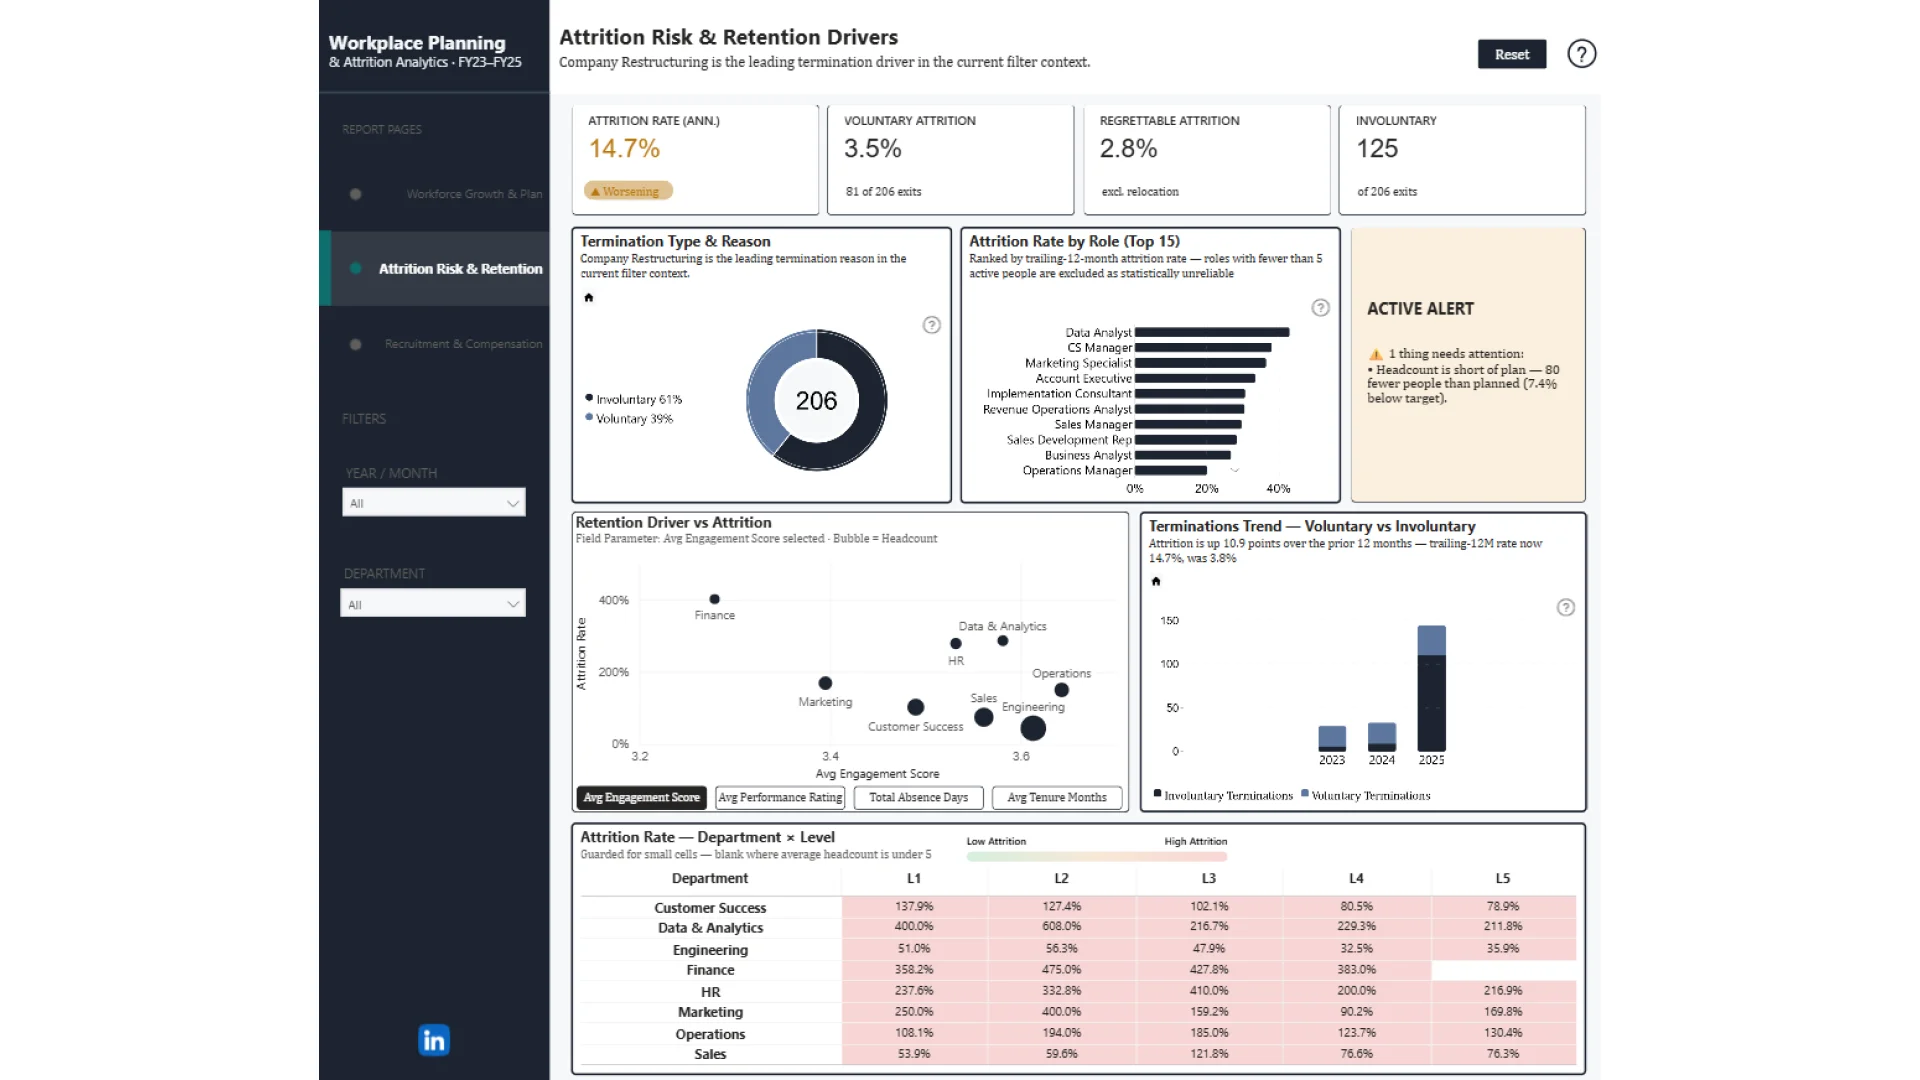
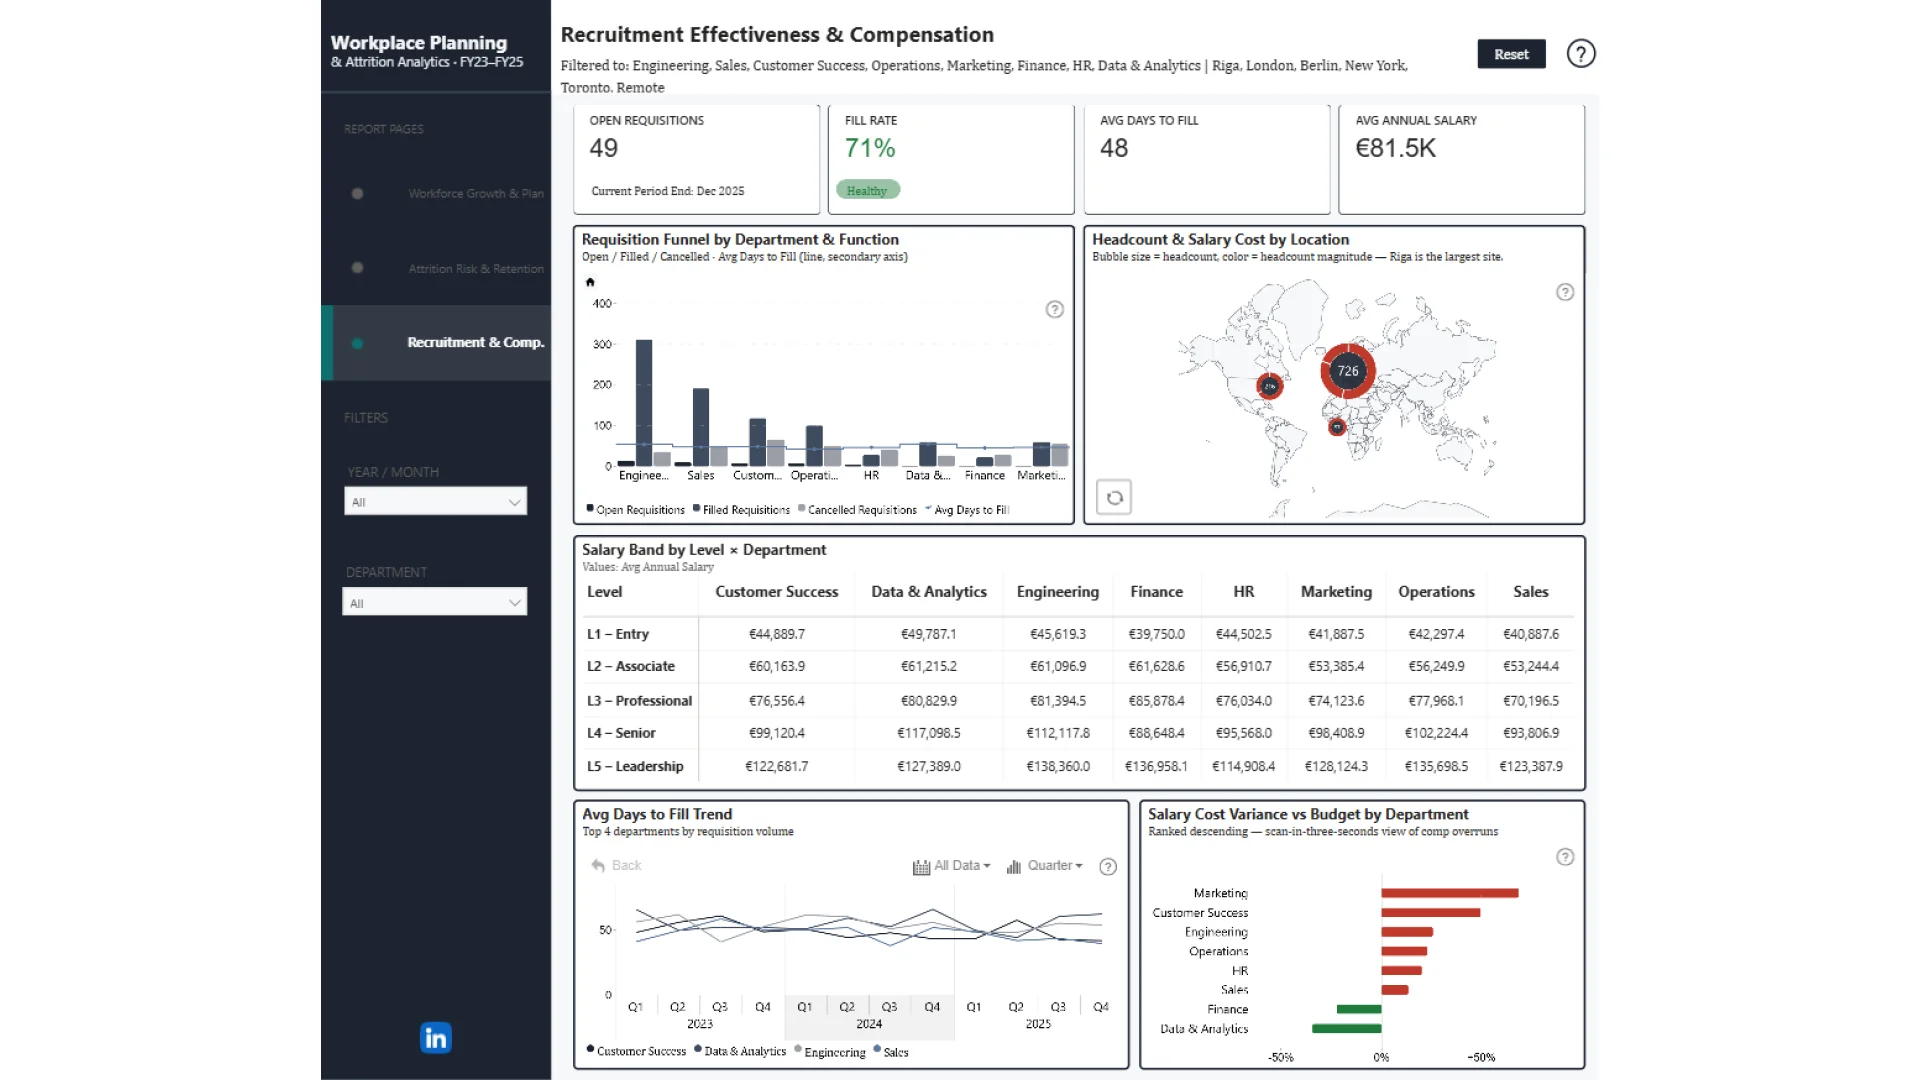
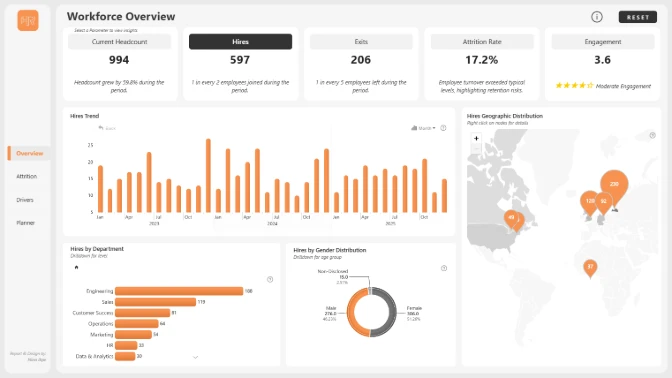
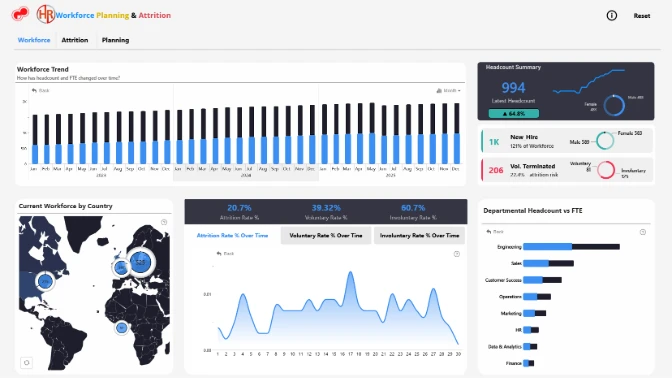
Explore retention and attrition analysis in this Power BI report built for the ZoomCharts 4U Report Challenge July 2026. The HR workforce planning dataset supports analysis of engagement, performance, absence, tenure, and exits.
Author's Description:
This interactive HR analytics report compares actual workforce levels against planned headcount, FTE, and salary costs to help organizations identify staffing gaps and attrition risks. Built on 12 interconnected data tables covering employee profiles, workforce planning, hiring, terminations, compensation, performance, engagement, absenteeism, and recruitment, it provides a comprehensive view of workforce health from 2023–2025. Key insights include a 7.4% headcount shortfall, rising 14.7% trailing-12-month attrition driven by organizational restructuring, and salary costs 19.7% above budget despite fewer employees than planned. Interactive ZoomCharts custom visuals enable users to explore workforce trends, department and role performance, attrition drivers, and geographic distribution through intuitive drill-down analysis.
ZoomCharts visuals used





4U Report Challenges
Participate in data challenges, build and submit reports to get free template downloads.
Join CommunityMobile view allows you to interact with the report. To Download the template please switch to desktop view.
How to use a PBIX template
Preview the interactive report, download the PBIX file, open it in Power BI Desktop, and replace the same data connection with your own dataset.
Preview and download
Explore the report online and download the PBIX template file.
Open in Power BI Desktop
Open the downloaded PBIX file in Power BI Desktop.
Connect your data
Replace the sample data source with your own dataset.
Refresh and adjust
Refresh the model and update fields or visual were needed.
Save and share
Save your report and publish it for your audience.


