logo
For Power BI
  • Products
    • Custom Visuals for Power BI
    • Report Templates
  • Resources

      Resources

    • Documentation
    • Report Examples
    • Blog
    • Webinars
    • Video Tutorials
    • Visuals Gallery

    Support

    • ZoomCharts Assistance
    • Contact Sales
    • Contact Support
    • FAQ

    Challenges

    Challenges

    Improve your report creation skills by participating in free challenges for report creators.

    Learn more
    Get Developer License
  • Services
    • Power BI Report Development
    • Custom Visual Development
  • Challenges
  • Pricing
    • Custom Visuals for Power BI
    • Report Templates
Subscribe
Subscribe
Get it now
Go back

Contents

Contest logo
Contest logo
Contest logo
Contest logo
Try Free Now
Go back

Onyx Data March 2024 Challenge

Report Author: Balu Chelluri

78

Germany Car Sales

Report
Report Interact

Timeline Map Sales

Share template with others

Report submitted for Onyx Data DataDNA ZoomCharts Mini Challenge, March 2024. The report was built based on eBay Used Car Sales Analysis dataset and includes ZoomCharts custom Drill Down PRO visuals for Power BI. 

Author's description:
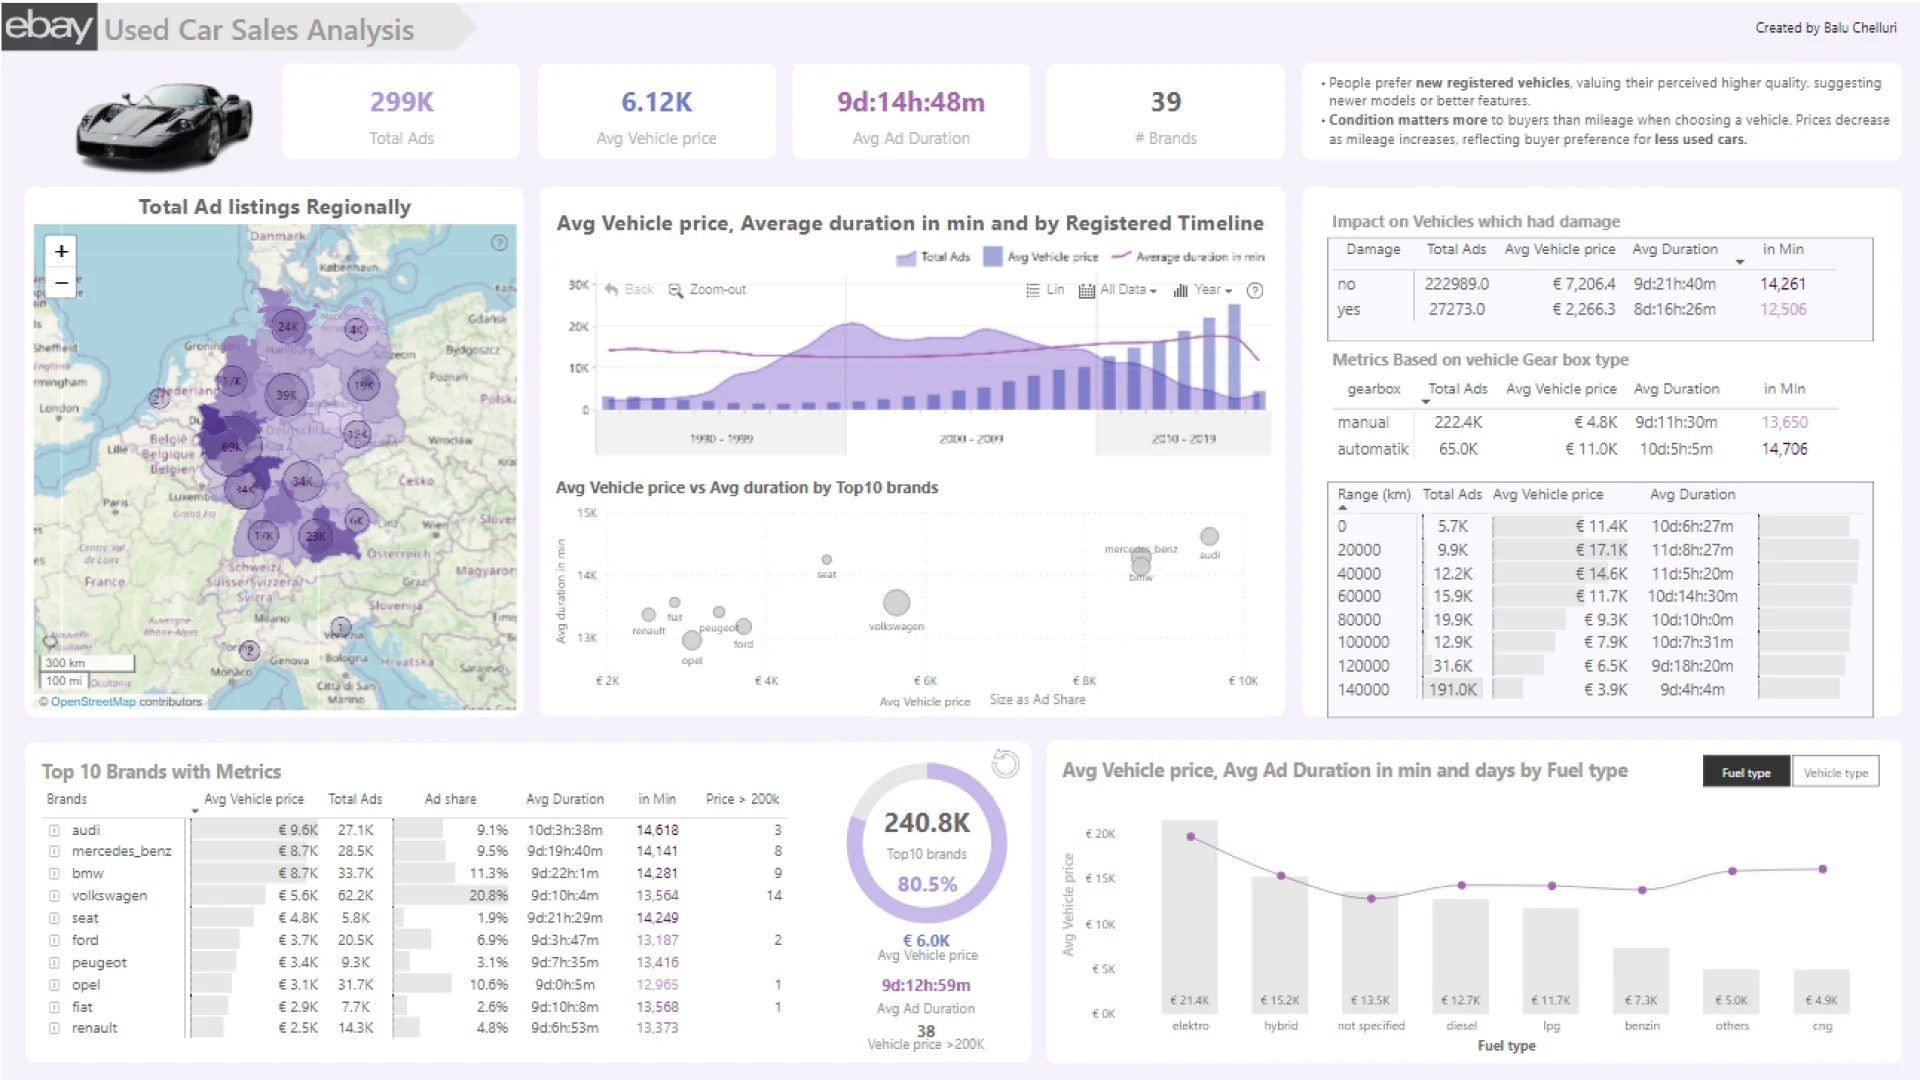
For this project, I envision myself as a Data Analyst working at an analytical firm called 'Onyx Data Solutions,' partnered with eBay. The Regional Sales Manager of Germany wants to understand the purchasing behavior of used cars and their buyers, and I'm here to assist them.

Understanding the Data and Setting Boundaries (For the Technical Staff at eBay): The data was scraped from the eBay website for two months (March 2016, April 2016) by the team at Onyx. The initial number of ads/listings is around 371k. This includes a wide range of vehicles, from budget-friendly options to luxury cars. The maximum price in the listings is approximately 2.15 billion, indicating the presence of extremely high-end vehicles. Within this dataset, only 411 vehicles are priced over 100k (0.1%), while 70 entries are priced above 1 million. This highlights the diversity in pricing within the listings, with the majority falling below the 100k mark (99.9%). However, it's important to note that there may be genuine high-end vehicles priced above this threshold. Notably, luxury brands like Porsche, Ferrari, Lamborghini, and Maserati account for only around 60 ads with an average price of 363k. This concentration of luxury vehicles could skew our analysis if not properly accounted for. To mitigate this, I've decided to increase the price limit from 100k to 200k, reducing the listings from 411 to 173. Additionally, there are some entries with zero prices. Sometimes users post these as a sign for open-to-bargain deals, so I haven't considered these listings for pricing analysis. In addition to considering price, I've also limited our analysis by registration year. Only entries from 1990 to the date of crawling are being considered. This helps ensure that we're focusing on vehicles that are relevant and current. Some entries had random registration years (e.g., 999, 2099), which were excluded from our analysis during data cleaning. After conducting data cleaning and applying the aforementioned limits, the resultant listings are around 299k (80.5%).

My analysis focuses on four key metrics:
Average Ad Price: This metric aims to determine the average listing price of the vehicles in the dataset.
Average Ad Duration: This metric measures the average time it takes for a listing/ad to be sold or removed by the user. It provides insights into the velocity of vehicle sales.
Total Ads: This metric represents the total number of advertisements or listings in the dataset. It provides an overview of the volume of vehicle listings available for analysis.
Ads Share: This metric quantifies the share of ads for each brand and model of vehicles. It helps identify the distribution of advertisements across different brands and models within the dataset.
My aim is to gain insights into the trends and patterns within the dataset by examining these metrics.

ZoomCharts visuals used

Drill Down Map PRO Drill Down Map PRO
Drill Down Timeline PRO Drill Down Timeline PRO

Need help?

Send your question to ZoomCharts assistant, and we will respond to you as soon as possible.

Contact Us

Mobile view allows you to interact with the report. To Download the template please switch to desktop view.

Report Overhaul

ZoomCharts Academy

Learn ZoomCharts with experts and become certified!

Go to Academy!
Report Overhaul

Was this helpful? Thank you for your feedback!

Sorry about that.

How can we improve it?

Germany Car Sales

Share

ZoomCharts

Welcome to ZoomCharts

You’re almost there! Create an account to keep your saved reports.

or
Sign up with Microsoft

Verify your email address

We have sent a code to your email address. Please input the code below.

Didn't receive code? Request again (after 30 seconds)

Already have an account? Log in

ZoomCharts

Log in to your ZoomCharts account

Log in with Microsoft
or
Forgot password?

Reset your password

We'll email you instructions on how to reset your password

Don't have an account? Sign up

Please add credits

You have 0 available downloads.
Get more credits or upgrade your plan to continue.

View pricing
logo
[email protected]
+44 204 577 3993
logo

Products

Drill Down Network PRO Drill Down Waterfall PRO Drill Down Graph PRO Drill Down Combo PRO Drill Down Combo Bar PRO Drill Down Donut PRO Drill Down Pie PRO Drill Down TimeSeries PRO Drill Down Timeline PRO Drill Down Map PRO Drill Down Scatter PRO All Visuals

Resources

Report Examples Webinars Blog ZoomCharts Academy Visuals Gallery Documentation Custom Visual Development Subscribe to News

Solutions

Custom Visual Development

Company

Pricing About Us Partners Leave feedback Join PowerGroup EU Funding

Help

ZoomCharts Assistance Contact Sales Contact Support FAQ

Drill Down Network PRO Drill Down Waterfall PRO Drill Down Graph PRO Drill Down Combo PRO Drill Down Combo Bar PRO Drill Down Donut PRO Drill Down Pie PRO Drill Down TimeSeries PRO Drill Down Timeline PRO Drill Down Map PRO Drill Down Scatter PRO All Visuals

Report Examples Webinars Blog ZoomCharts Academy Visuals Gallery Documentation Custom Visual Development Subscribe to News

Custom Visual Development

Pricing About Us Partners Leave feedback Join PowerGroup EU Funding

ZoomCharts Assistance Contact Sales Contact Support FAQ
+44 204 577 3993
[email protected]

Ready to get in touch?

Contact our experts with any question about Power BI and ZoomCharts for Free!

Contact us

© 2025, Data Visualization Software Lab

U.S. Patents No. 11,645,343; 11,921,804; 12,346,389

Cookies
Privacy Policy
Global
Legal
Patent
warning

Error message

success

Success info: Done!

ZoomCharts AI Assistant

We noticed you're using an old OS version.

For the best experience, we recommend upgrading to ensure that all website features display correctly.

Cookie settings

We use necessary cookies for site functionality, as well as statistic, marketing, and preference cookies to enhance your experience. For more information and to manage your preferences, please visit our Cookie policy