629
Games analysis
Games analysis
Report Author: Ngoc Duong
629
Share template with others
Report submitted for FP20 Analytics ZoomCharts Challenge 18 (August 2024). The report was built with the Mobile Game Analysis dataset and includes ZoomCharts custom Drill Down PRO visuals for Power BI.
Author's description:
Some key metrics and insights:
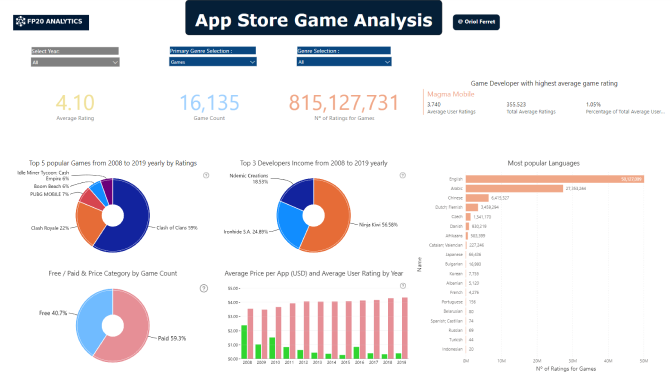
- Top 5 most popular games 2008-2019 yearly.
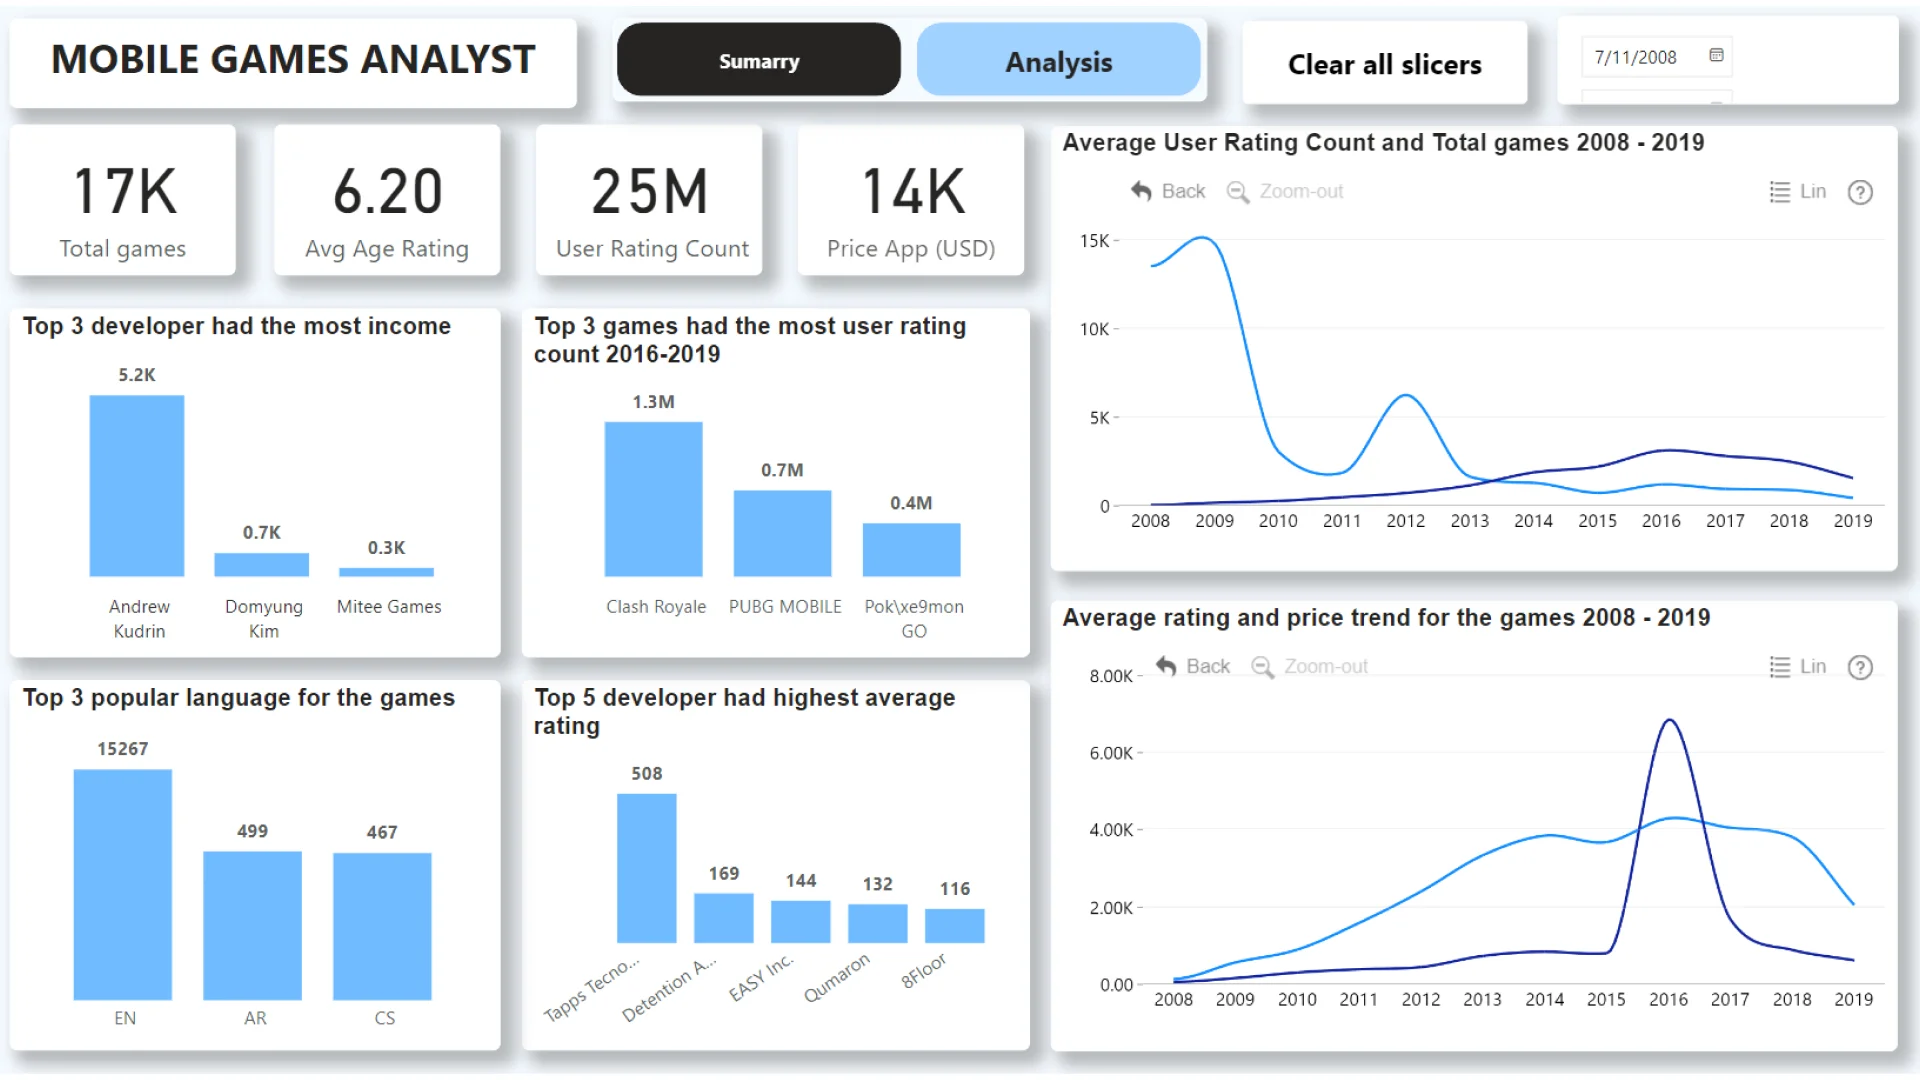
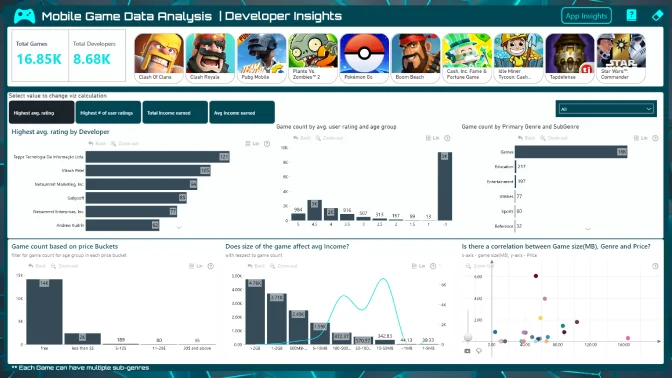
- Developer had the highest average game rating.
- Top 3 game developers had income from their app store games 2008-2019.
- The average rating and price trend for the games 2008-2019.
- Top 3 popular language 2008-2019.
- Top 3 games had the most user rating count 2016-2019.
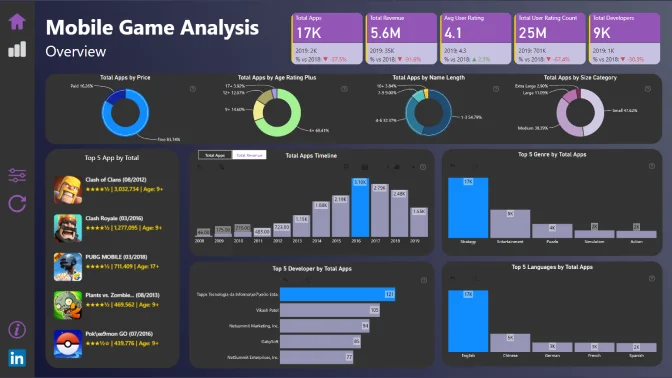
- The most popular game genres every 3 years since 2008.
- Ratio between free and paid for price. Correlation between genre, game size and price.
- Total games by age rating, primary genres
4U Report Challenges
Participate in data challenges, build and submit reports to get free template downloads.
Join CommunityMobile view allows you to interact with the report. To Download the template please switch to desktop view.
Was this helpful? Thank you for your feedback!
Sorry about that.
How can we improve it?