756
FP20 Xmas Gift Sales - Nicolás San Marco
FP20 Xmas Gift Sales - Nicolás San Marco
More Report pages
Report Author: Nsanmarco Marco
756
Share template with others
Report submitted for FP20 Analytics ZoomCharts Challenge, December 2023. The report was built with Xmas Gift Sales dataset and includes ZoomCharts custom Drill Down PRO visuals for Power BI.
Author's description:
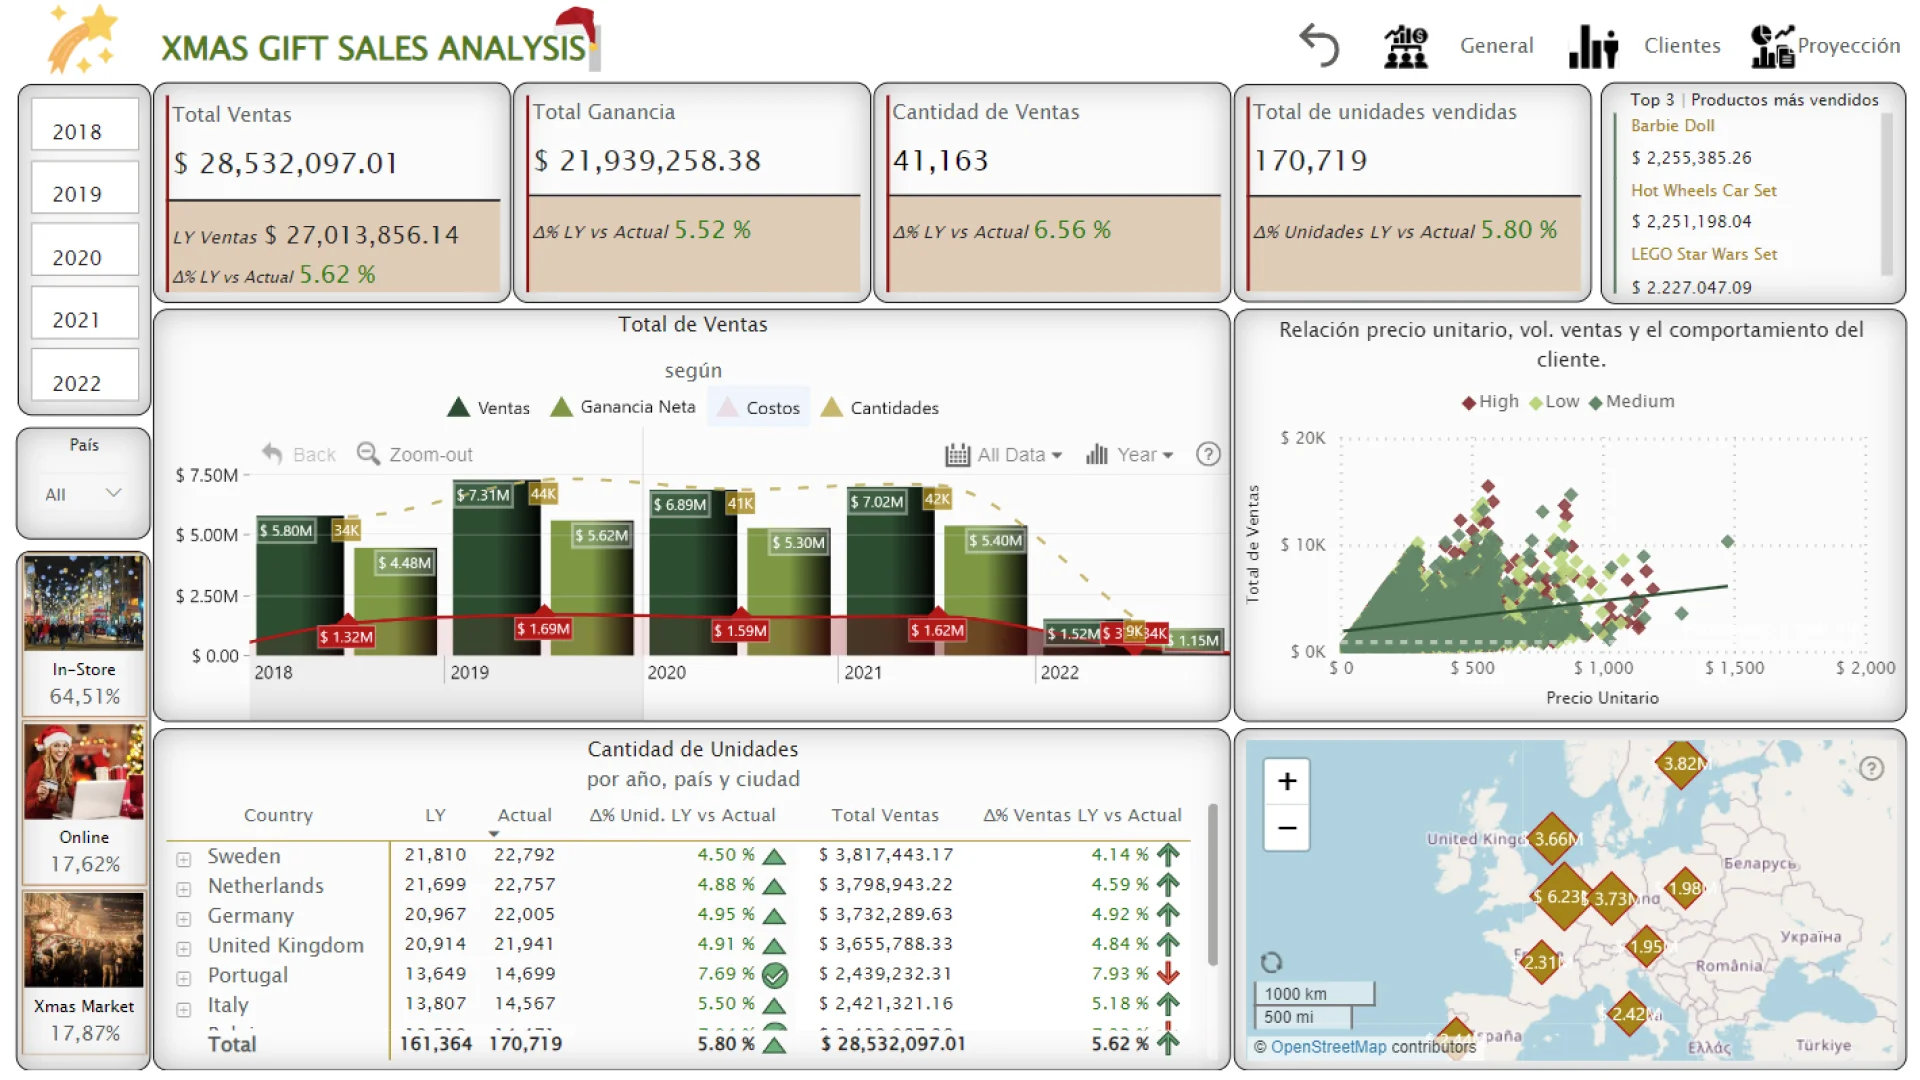
- General Presentation: The sales analysis dashboard of the toy company provides a comprehensive overview of various key aspects of business performance, offering fundamental insights for strategic planning.
- Christmas Sale Products: Using ZoomCharts bar charts, products with the highest sales in previous Christmas periods were identified. Analysis of trends and historical patterns to predict the most popular products for the upcoming year.
- Record Christmas Sales by Country: Detailed matrix of units sold by country, city, and annual comparison. Use of ZoomCharts map to visualize branch distribution in Europe.
- Purchase Trends: Scatter plot exploring the relationship between unit price, sales volume, and customer behavior based on budgets. Evaluation of historical data to forecast the dominant trend in purchasing types.
- Customer Segmentation: Use of dynamic filters to analyze demographic data. ZoomCharts drill-down network chart to identify the relationship between customer type, budget, and payment method.
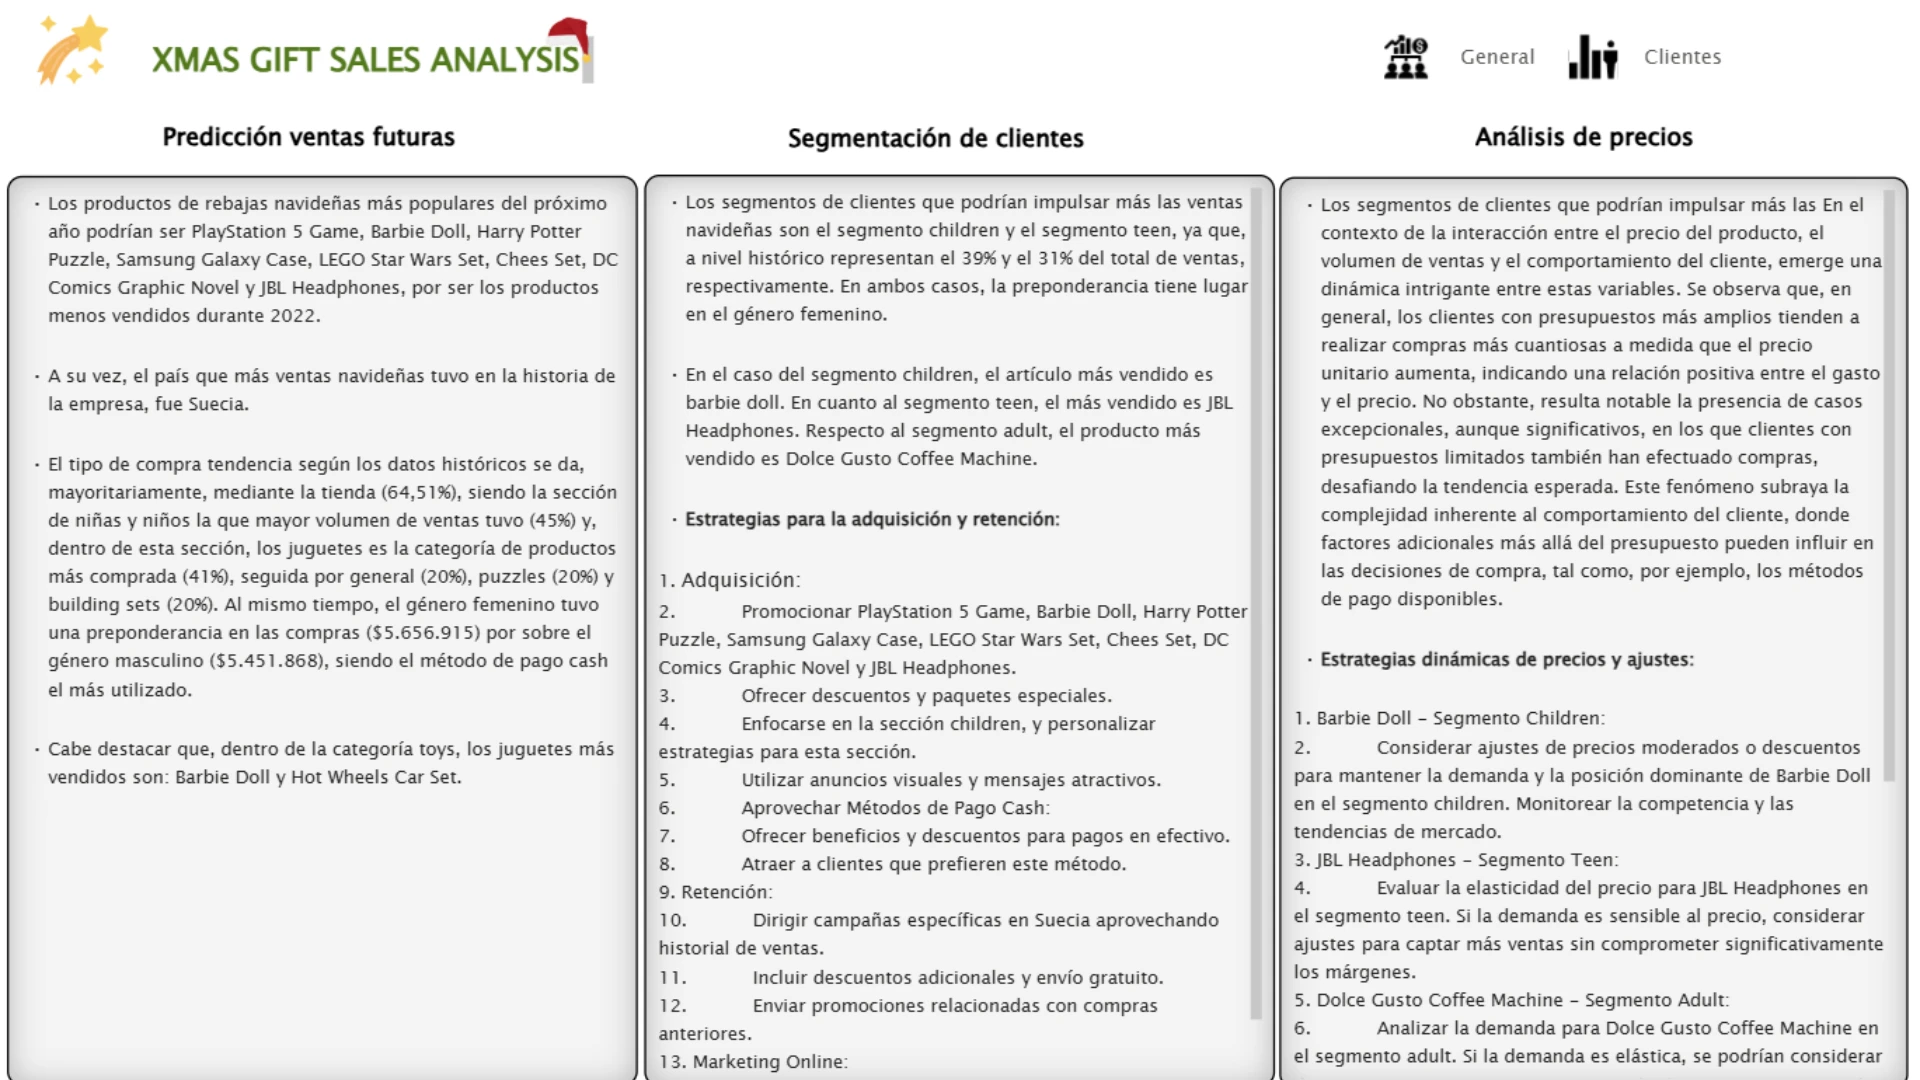
- Favorite Items by Customer Segment: Detailed information on the preferred Christmas purchase item for each customer segment. Breakdown of demographic data and purchasing patterns.
- Acquisition and Retention Strategies: Personalized recommendations based on customer segment knowledge. Specific strategies for customer acquisition and retention.
- Price, Sales Volume, and Customer Behavior Relationship: Analysis of ZoomCharts bar charts exploring the relationship between product price, sales volume, and customer behavior.
- Dynamic Pricing Strategies: Development of dynamic pricing strategies to optimize profits and maintain competitiveness. Recommendations for price adjustments based on demand and market trends.
Visualization Section: "General" Section (First Page): Comparative cards for total sales, profits, quantity of products, and operations. Top 3 best-selling products. ZoomCharts deep dive bar graph. Scatter plot to assess the relationship between unit price, sales volume, and customer behavior. Detailed matrix of units sold by country and city. ZoomCharts map to visualize branches in Europe. Dynamic filters by year, country, and sales section.
"Customers" Section (First Page): Filters by countries, years, and sales section. ZoomCharts deep dive bar chart for sold products, payment method, and gender. ZoomCharts drill-down network chart to assess the relationship between customer type, budget, and payment method. ZoomCharts pie chart to assess the relationship between type, category, and product name. Detailed table of payment methods by gender.
Conclusions and Projections: On the second page, detailed results, future projections, and strategic recommendations are provided. This report not only presents a comprehensive analysis of past sales but also provides a solid foundation for future decision-making, enabling the company to anticipate and adapt to market trends with a proactive approach.
ZoomCharts visuals used
4U Report Challenges
Participate in data challenges, build and submit reports to get free template downloads.
Join CommunityMobile view allows you to interact with the report. To Download the template please switch to desktop view.


Was this helpful? Thank you for your feedback!
Sorry about that.
How can we improve it?