488
FP20 North America Retail Supply Chain Analysis
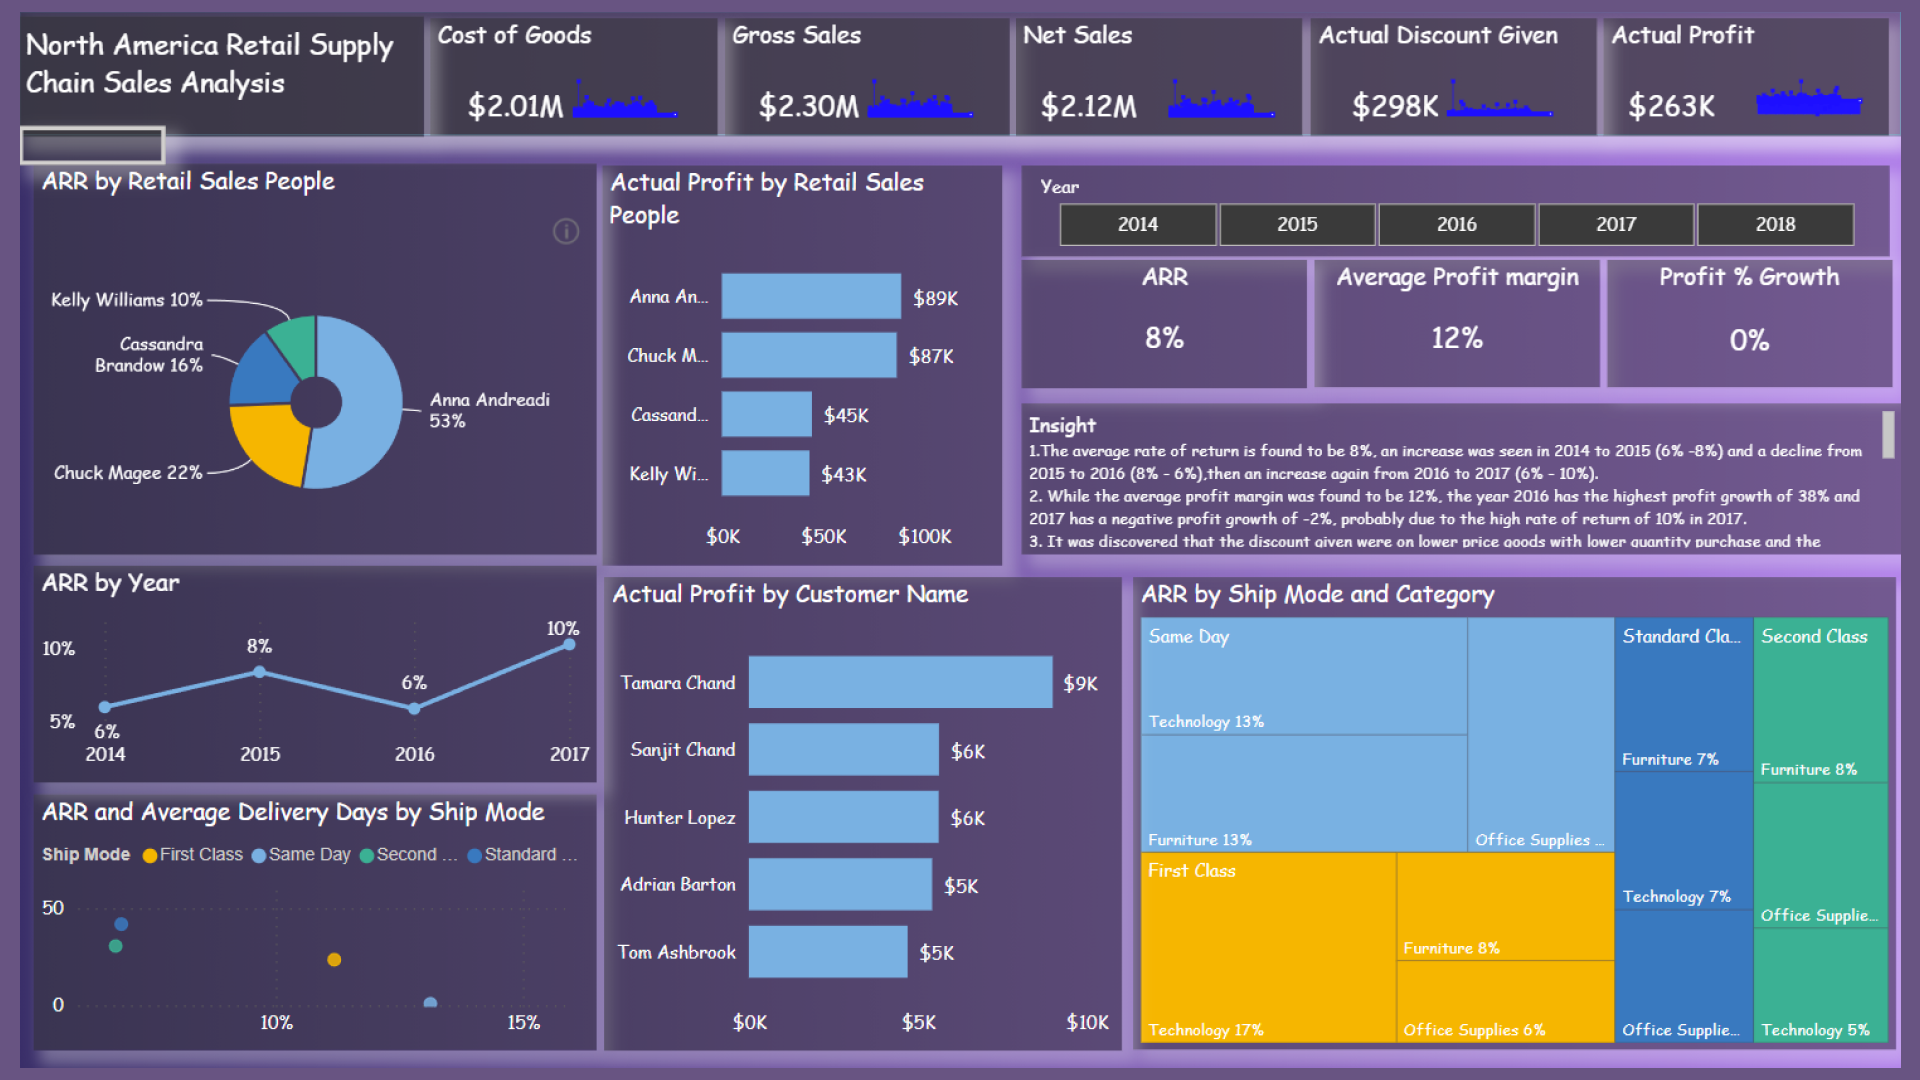
FP20 North America Retail Supply Chain Analysis
Report Author: Oluwatoyin Senu
488
Share template with others
Report submitted for FP20 Analytics ZoomCharts Challenge, October 2023. The report was built with North America Retail Supply Chain and Sales Analysis dataset and includes ZoomCharts custom Drill Down PRO visuals for Power BI.
Author's description:
This report detailed the analysis and insights on the retail sales which are the average rate of return, profit, gross sales, net sales, and the discount given which impacted negatively on profit and also recommendation to maximize profit.
4U Report Challenges
Participate in data challenges, build and submit reports to get free template downloads.
Join CommunityMobile view allows you to interact with the report. To Download the template please switch to desktop view.
Was this helpful? Thank you for your feedback!
Sorry about that.
How can we improve it?