logo
For Power BI
  • Products
    • Custom Visuals for Power BI
    • Report Templates
  • Resources

      Resources

    • Documentation
    • Report Examples
    • Blog
    • Webinars
    • Video Tutorials
    • Visuals Gallery

    Support

    • ZoomCharts Assistance
    • Contact Sales
    • Contact Support
    • FAQ

    Challenges

    Challenges

    Improve your report creation skills by participating in free challenges for report creators.

    Learn more
    Get Developer License
  • Services
    • Power BI Report Development
    • Custom Visual Development
  • Challenges
  • Pricing
    • Custom Visuals for Power BI
    • Report Templates
Subscribe
Subscribe
Get it now
Go back

Contents

Contest logo
Contest logo
Contest logo
Contest logo
Try Free Now
Go back

FP20Analytics November 2023 Challenge

Report Author: Bimal Bsp

166

FP20 Data Challenge : Crime Insights

Report
Report Interact

Timeline Map Network Donut Crime analytics Research

Share template with others

Report submitted for FP20 Analytics ZoomCharts Challenge, November 2023. The report was built with Tactical Crime Analysis dataset and includes ZoomCharts custom Drill Down PRO visuals for Power BI. 

Author's description:
🔵 FP20 Data Challenge Report Overview The report has been segregated into Summary & Details. The summary page describes the Time-based analysis, Understanding of the UK crime types, and people's involvement in such crimes. The details sheet defines the in-depth analysis of crimes with hotspots and the correlation of persons who commit crimes. The report pages were designed for self-understanding and quick notes on visuals. The best user experience to follow, read patiently.
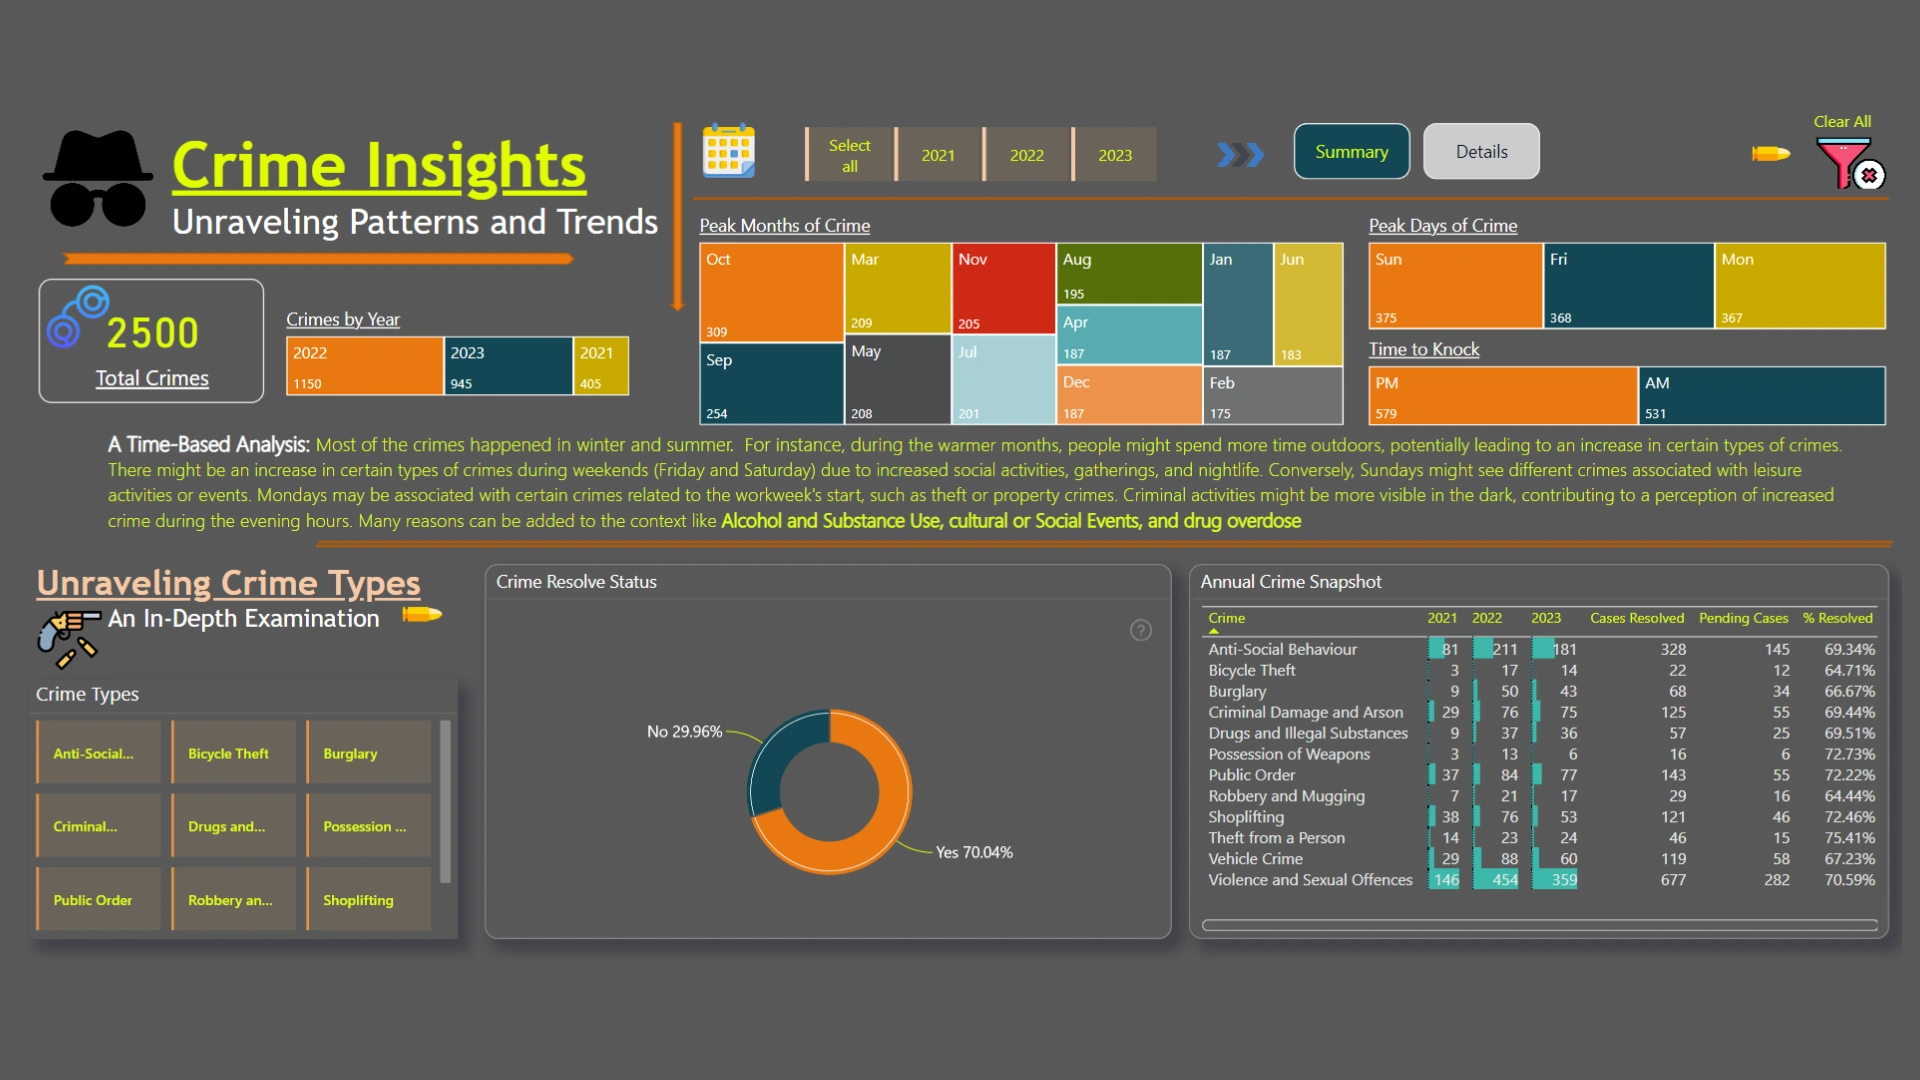
🔵 Summary Time-Based Analysis: Year slicers select the year of interest with a clear all slicers button to unselect the previous selection. >>> Highlighted the pages incorporated in the report. Clear All Slicer icon to remove the selections. A drill-through approach has been added to the crimes by year tree map to understand the monthly contribution, hot areas, and involvement of persons with those crimes.
🔸 Read the visuals > Card visual of total crimes differentiated by year, peak months, day & and hours to watch. > Analysis commentary with an explanation. Crime Types: Crime type slicers to minimize the data.
🔸 Read the visuals > ZoomCharts drill down data to know the case resolve status and the area to look on. > Table visuals of the yearly progression. > Insight and focus area commentary.
🔵 Ethnicity and Gender: Card visual of total crimes. Slicers to minimize the data based on gender.
🔸 Read the visuals > ZoomCharts drill down network pro visual to understand the relationship between the genders, age groups, and the ethnicity of people involved. > Stacked bar chart to show the gender dynamics in crime roles. > Line chart to know the crimes by year and which groups required more attention. > Insights of the visuals.
🔵Details > Drill through approach added as advised in the overview sheet. > ZoomCharts map visual shows the high crime areas with the most crimes incorporated. > Scatter plot to understand the manpower used to do the crimes. > Action points to reduce the crimes.

ZoomCharts visuals used

Drill Down Network PRO Drill Down Network PRO
Drill Down Map PRO Drill Down Map PRO
Drill Down Timeline PRO Drill Down Timeline PRO
Drill Down Donut PRO Drill Down Donut PRO

Need help?

Send your question to ZoomCharts assistant, and we will respond to you as soon as possible.

Contact Us

Mobile view allows you to interact with the report. To Download the template please switch to desktop view.

Report Overhaul

ZoomCharts Academy

Learn ZoomCharts with experts and become certified!

Go to Academy!
Report Overhaul

Was this helpful? Thank you for your feedback!

Sorry about that.

How can we improve it?

FP20 Data Challenge : Crime Insights

Share

ZoomCharts

Welcome to ZoomCharts

You’re almost there! Create an account to keep your saved reports.

or
Sign up with Microsoft

Verify your email address

We have sent a code to your email address. Please input the code below.

Didn't receive code? Request again (after 30 seconds)

Already have an account? Log in

ZoomCharts

Log in to your ZoomCharts account

Log in with Microsoft
or
Forgot password?

Reset your password

We'll email you instructions on how to reset your password

Don't have an account? Sign up

Please add credits

You have 0 available downloads.
Get more credits or upgrade your plan to continue.

View pricing
logo
[email protected]
+44 204 577 3993
logo

Products

Drill Down Network PRO Drill Down Waterfall PRO Drill Down Graph PRO Drill Down Combo PRO Drill Down Combo Bar PRO Drill Down Donut PRO Drill Down Pie PRO Drill Down TimeSeries PRO Drill Down Timeline PRO Drill Down Map PRO Drill Down Scatter PRO All Visuals

Resources

Report Examples Webinars Blog ZoomCharts Academy Visuals Gallery Documentation Custom Visual Development Subscribe to News

Solutions

Custom Visual Development

Company

Pricing About Us Partners Leave feedback Join PowerGroup EU Funding

Help

ZoomCharts Assistance Contact Sales Contact Support FAQ

Drill Down Network PRO Drill Down Waterfall PRO Drill Down Graph PRO Drill Down Combo PRO Drill Down Combo Bar PRO Drill Down Donut PRO Drill Down Pie PRO Drill Down TimeSeries PRO Drill Down Timeline PRO Drill Down Map PRO Drill Down Scatter PRO All Visuals

Report Examples Webinars Blog ZoomCharts Academy Visuals Gallery Documentation Custom Visual Development Subscribe to News

Custom Visual Development

Pricing About Us Partners Leave feedback Join PowerGroup EU Funding

ZoomCharts Assistance Contact Sales Contact Support FAQ
+44 204 577 3993
[email protected]

Ready to get in touch?

Contact our experts with any question about Power BI and ZoomCharts for Free!

Contact us

© 2025, Data Visualization Software Lab

U.S. Patents No. 11,645,343; 11,921,804; 12,346,389

Cookies
Privacy Policy
Global
Legal
Patent
warning

Error message

success

Success info: Done!

ZoomCharts AI Assistant

We noticed you're using an old OS version.

For the best experience, we recommend upgrading to ensure that all website features display correctly.

Cookie settings

We use necessary cookies for site functionality, as well as statistic, marketing, and preference cookies to enhance your experience. For more information and to manage your preferences, please visit our Cookie policy