logo
For Power BI
  • Products
    • Custom Visuals for Power BI
    • Report Templates
  • Resources

      Resources

    • Documentation
    • Report Examples
    • Blog
    • Webinars
    • Video Tutorials
    • Visuals Gallery

    Support

    • ZoomCharts Assistance
    • Contact Sales
    • Contact Support
    • FAQ

    Challenges

    Challenges

    Improve your report creation skills by participating in free challenges for report creators.

    Learn more
    Get Developer License
  • Services
    • Power BI Report Development
    • Custom Visual Development
  • Challenges
  • Pricing
    • Custom Visuals for Power BI
    • Report Templates
Subscribe
Subscribe
Get it now
Go back

Contents

Contest logo
Contest logo
Contest logo
Contest logo
Try Free Now
Go back

FP20 Analytics September 2024 Challenge

Report Author: Chiemezuo Ngerem

80

FP20 Analytics: SCN Cosmetics - E-commerce analysis

Report
Report Interact

Pie Combo Combo Bar TimeSeries Map Donut Ecommerce Sales

Share template with others

Report submitted for FP20 Analytics ZoomCharts Challenge 19 (September 2024). The report was built with the E-commerce KPI Analysis dataset and includes ZoomCharts custom Drill Down PRO visuals for Power BI. 

Author's description:
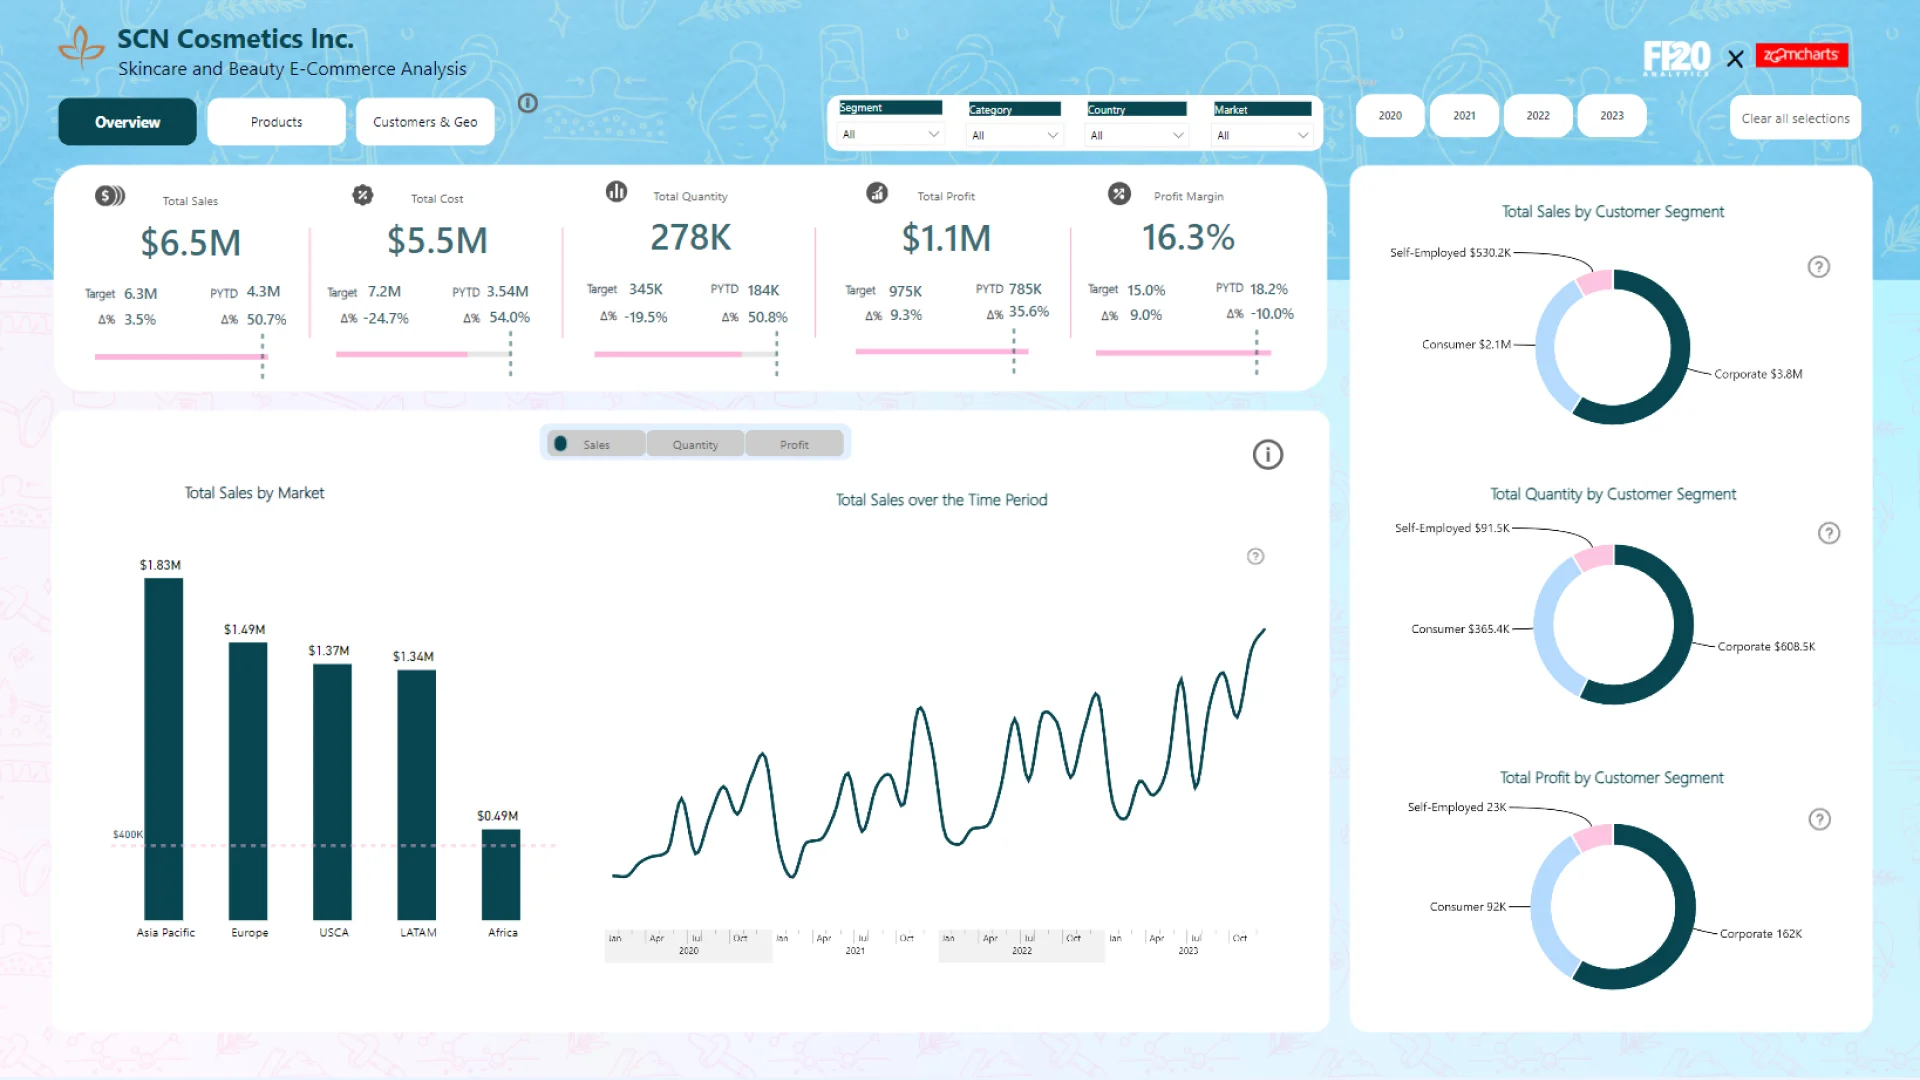
This dashboard provides an insightful overview of SCN Cosmetics' performance across key business metrics, analyzing sales, customer segment, product performance, and market geography. Total sales YTD reached an impressive $6.5M, a clear indicator of SCN Cosmetics' robust market presence. The company engaged with over 17K customers throughout the year, showcasing a broad and diverse customer base. This translates into $1.1M in profit, yielding a 16.3% profit margin—a healthy return, despite slight pressures from costs and discount strategies, evidenced by a 14.3% loss margin. Total Sales by Market reveals that the United States, with $1.24M in sales, is the company's largest market, followed by Australia, France.

Diving deeper into customer behavior, SCN Cosmetics segments its customers into Self-Employed, Consumer, and Corporate groups. Interestingly, the corporate segment accounts for the majority of sales, quantity sold and profit, making up the largest share of SCN’s business, which highlights the retail-driven nature of the business. With a closer look at product performance showcases Herbal Essence Bio as the top-selling product, followed by Rose Gold Petals Studs and Sterling Wave Earrings. These premium products likely contribute to the strong profit margin. However, we also have the bottom-performing products indicate areas for potential improvement in marketing or inventory management. Sales have followed an upward trend throughout the year, with notable spikes during promotional periods, likely driven by marketing campaigns or seasonal events. This indicates a successful strategy in leveraging discounts or limited-time offers to drive demand. The scatter plot showing the relationship between price discounts and sales quantity reveals a positive correlation. When discount rates increase, sales also tend to rise, confirming that SCN Cosmetics has successfully used discounts to stimulate demand. However, a balance is needed to avoid eroding profit margins through excessive discounts. A map visualization highlights USA as a rapidly growing market, contributing $1.14M in sales, which places it among the top five countries. This presents a unique growth opportunity for SCN Cosmetics to expand its product line in emerging markets.

In Conclusion, SCN Cosmetics is poised for continued success, with strong sales performance and a growing customer base across diverse markets. The data highlights several opportunities, such as maintaining and expanding corporate segment and optimizing the discount strategy to maintain profit margins. Also, launching marketing campaigns for underperforming products so as to optimise sales and profit.

ZoomCharts visuals used

Drill Down Combo PRO Drill Down Combo PRO
Drill Down TimeSeries PRO Drill Down TimeSeries PRO
Drill Down Combo Bar PRO Drill Down Combo Bar PRO
Drill Down Pie PRO Drill Down Pie PRO
Drill Down Map PRO Drill Down Map PRO
Drill Down Donut PRO Drill Down Donut PRO

Need help?

Send your question to ZoomCharts assistant, and we will respond to you as soon as possible.

Contact Us

Mobile view allows you to interact with the report. To Download the template please switch to desktop view.

Report Overhaul

ZoomCharts Academy

Learn ZoomCharts with experts and become certified!

Go to Academy!
Report Overhaul

Was this helpful? Thank you for your feedback!

Sorry about that.

How can we improve it?

FP20 Analytics: SCN Cosmetics - E-commerce analysis

Share

ZoomCharts

Welcome to ZoomCharts

You’re almost there! Create an account to keep your saved reports.

or
Sign up with Microsoft

Verify your email address

We have sent a code to your email address. Please input the code below.

Didn't receive code? Request again (after 30 seconds)

Already have an account? Log in

ZoomCharts

Log in to your ZoomCharts account

Log in with Microsoft
or
Forgot password?

Reset your password

We'll email you instructions on how to reset your password

Don't have an account? Sign up

Please add credits

You have 0 available downloads.
Get more credits or upgrade your plan to continue.

View pricing
logo
[email protected]
+44 204 577 3993
logo

Products

Drill Down Network PRO Drill Down Waterfall PRO Drill Down Graph PRO Drill Down Combo PRO Drill Down Combo Bar PRO Drill Down Donut PRO Drill Down Pie PRO Drill Down TimeSeries PRO Drill Down Timeline PRO Drill Down Map PRO Drill Down Scatter PRO All Visuals

Resources

Report Examples Webinars Blog ZoomCharts Academy Visuals Gallery Documentation Custom Visual Development Subscribe to News

Solutions

Custom Visual Development

Company

Pricing About Us Partners Leave feedback Join PowerGroup EU Funding

Help

ZoomCharts Assistance Contact Sales Contact Support FAQ

Drill Down Network PRO Drill Down Waterfall PRO Drill Down Graph PRO Drill Down Combo PRO Drill Down Combo Bar PRO Drill Down Donut PRO Drill Down Pie PRO Drill Down TimeSeries PRO Drill Down Timeline PRO Drill Down Map PRO Drill Down Scatter PRO All Visuals

Report Examples Webinars Blog ZoomCharts Academy Visuals Gallery Documentation Custom Visual Development Subscribe to News

Custom Visual Development

Pricing About Us Partners Leave feedback Join PowerGroup EU Funding

ZoomCharts Assistance Contact Sales Contact Support FAQ
+44 204 577 3993
[email protected]

Ready to get in touch?

Contact our experts with any question about Power BI and ZoomCharts for Free!

Contact us

© 2025, Data Visualization Software Lab

U.S. Patents No. 11,645,343; 11,921,804; 12,346,389

Cookies
Privacy Policy
Global
Legal
Patent
warning

Error message

success

Success info: Done!

ZoomCharts AI Assistant

We noticed you're using an old OS version.

For the best experience, we recommend upgrading to ensure that all website features display correctly.

Cookie settings

We use necessary cookies for site functionality, as well as statistic, marketing, and preference cookies to enhance your experience. For more information and to manage your preferences, please visit our Cookie policy