1114
FP20 analytics Challenge 19 - Ecommerce KPI dashboard
FP20 analytics Challenge 19 - Ecommerce KPI dashboard
More Report pages
Report Author: Swati Gupta
1114
Share template with others
Report submitted for FP20 Analytics ZoomCharts Challenge 19 (September 2024). The report was built with the E-commerce KPI Analysis dataset and includes ZoomCharts custom Drill Down PRO visuals for Power BI.
Author's description:
The financial KPI reports focuses on sales made by E-commerce website in year 2020-2023 within 5 product categories namely, 1. Body care 2. Make up 3. Home & accessories 4. Face care 5. Hair care. The data is collected from various countries throughout the globe and Profit & loss values are indicated. The analysis is based on 3 criteria:
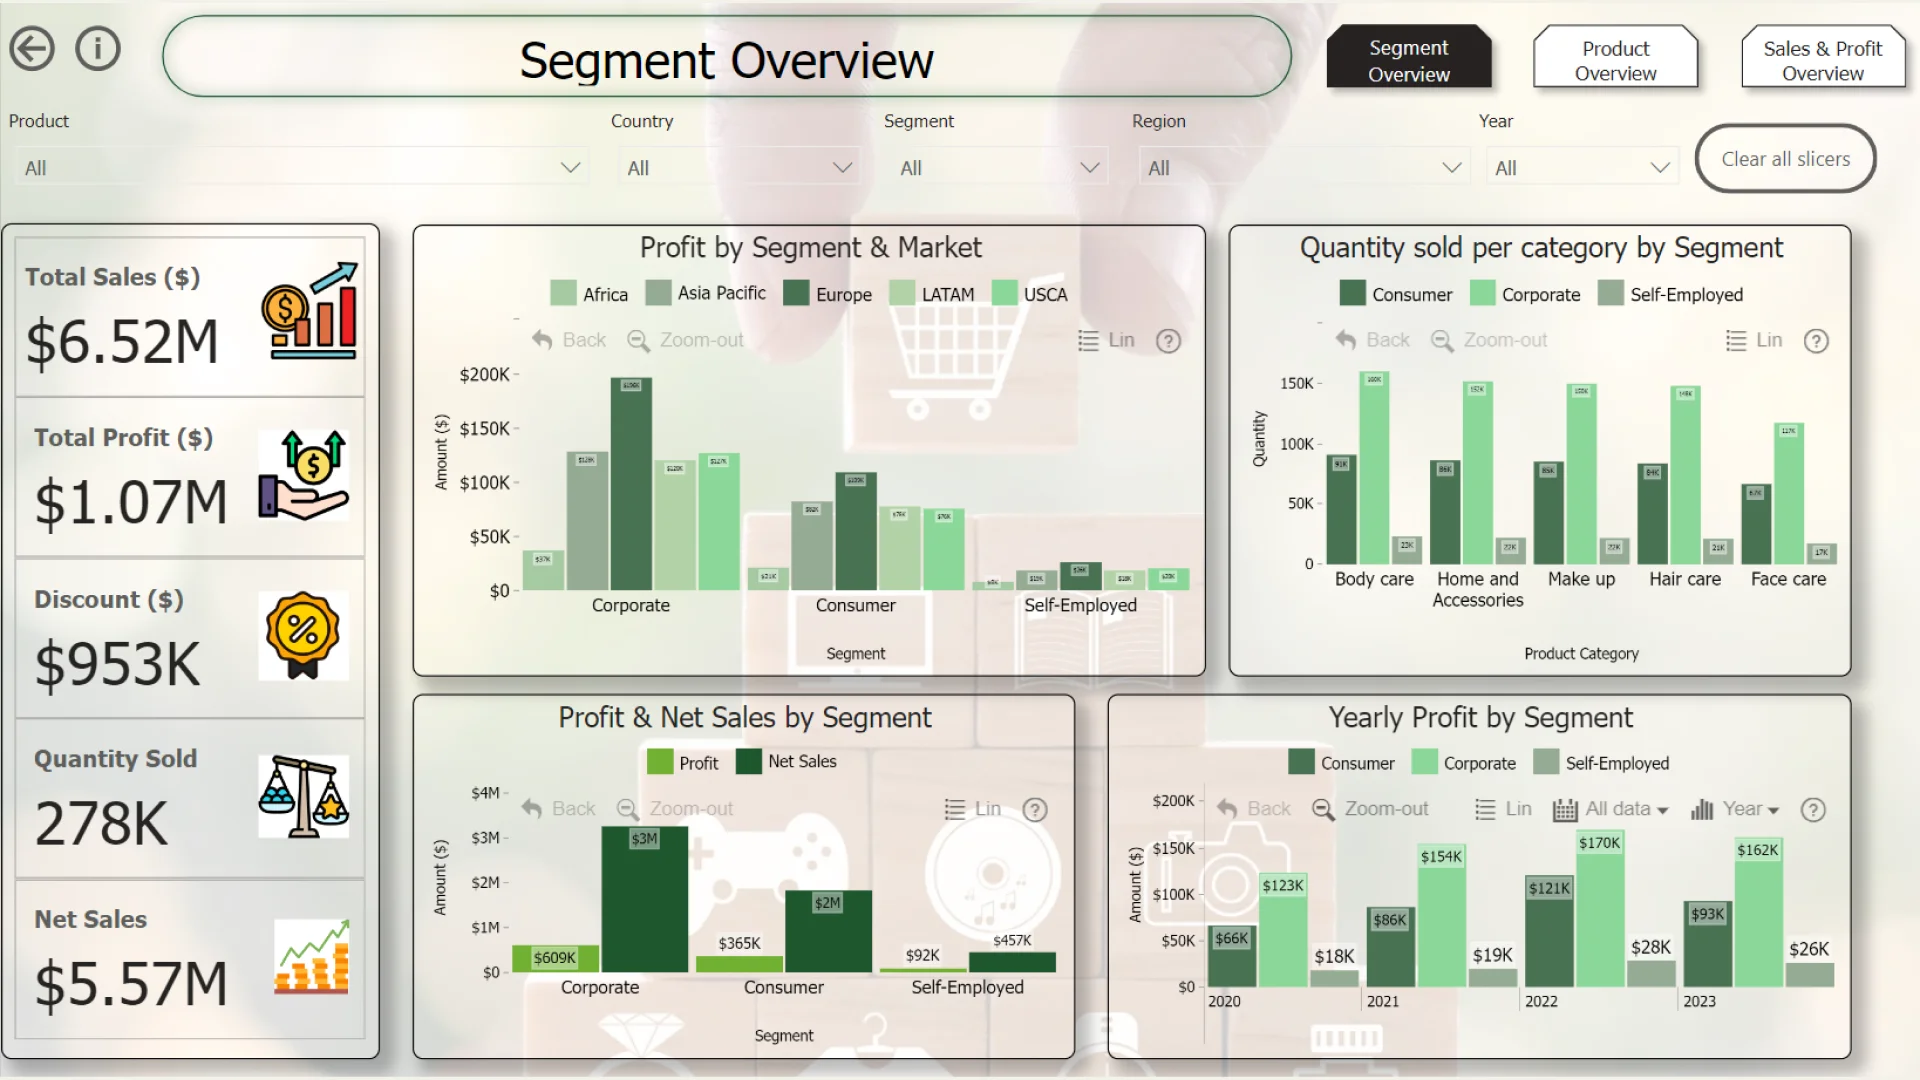
1. Segment Overview
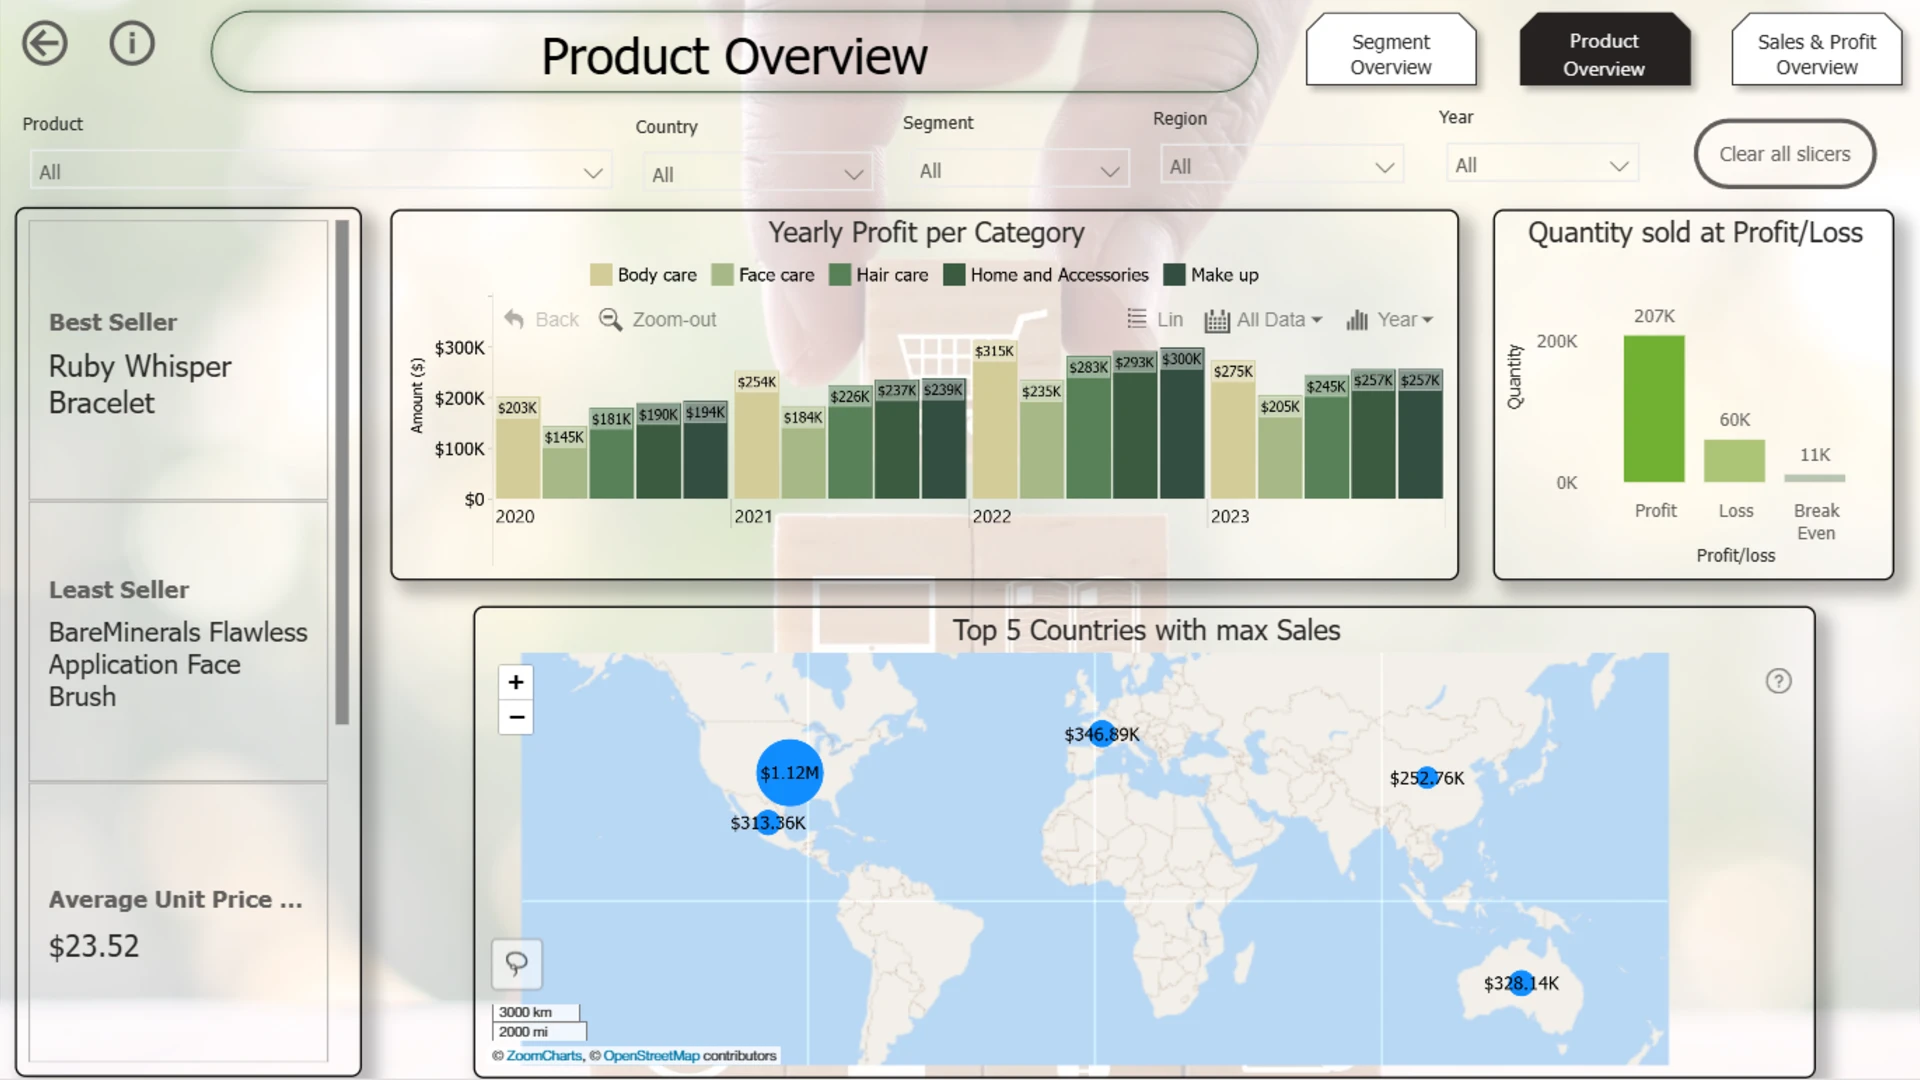
2. Product Overview
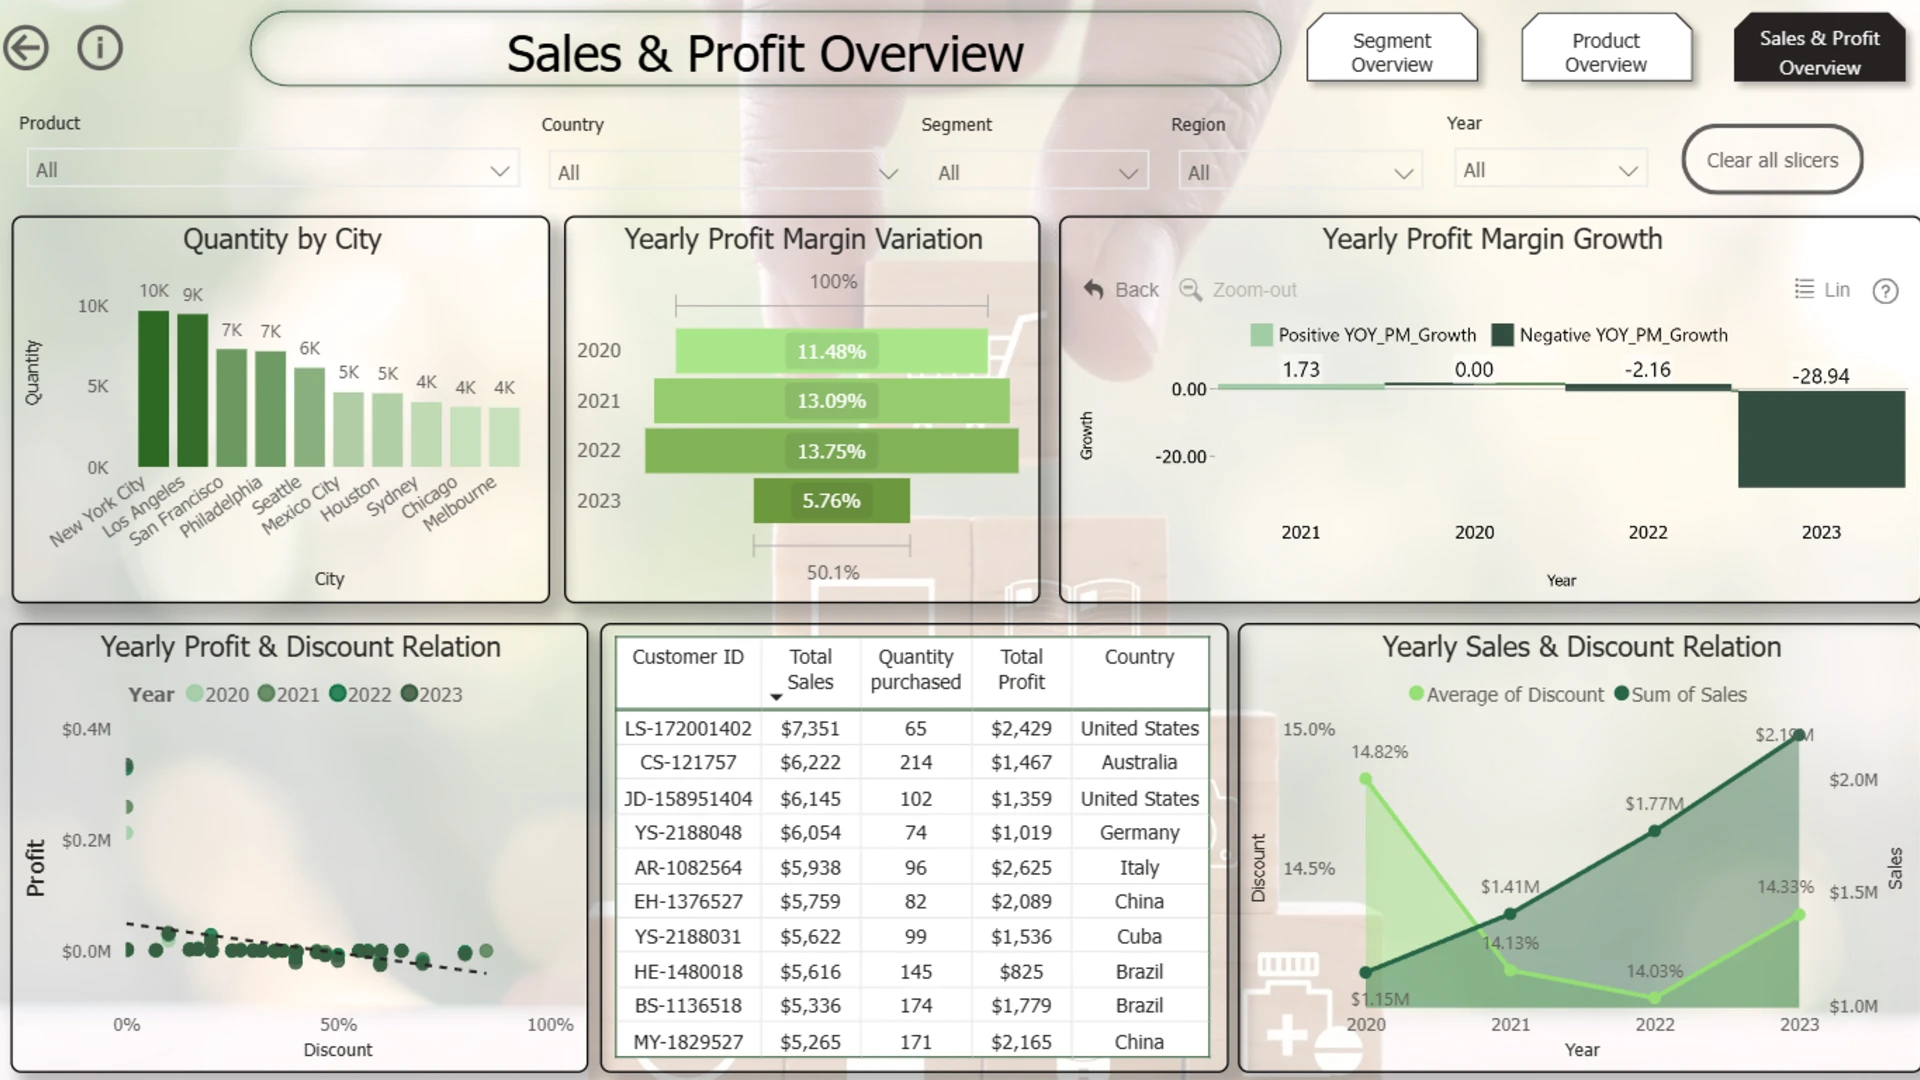
3. Sales & Profit Overview
The various KPIs are calculated:
1. Total Sales - $ 6.52M
2. Total Profit - $ 1.07M
3. Quantity Sold – 278K
4. Best Seller – Ruby Whisper Bracelet
5. Least Seller – Bare Minerals Flawless Application Face Brush.
Segment Overview: The customer segment is divided into 3 types:
1. Corporate
2. Consumer
3. Self employed
The analysis suggests that:
1. The corporate segment made highest profit around $609k throughout the span of 4 years.
2. The profit value increases gradually for corporate segment from 2020-2023 which is $123K in 2020 & $162K in 2023.
3. In 5 markets, profit was higher with corporate segment In Europe which is around $196K.
4. In each product category, corporate segment made highest purchases in body care department. To conclude, the future discount & promotional strategies should be made to attract more corporate segment customer which help to enhance the profit.
Product Overview: There are 5 product categories being sold. It can be analysed that:
1. The body care was profitable throughout the years which made consistent profit in each market.
2. Out of total quantities sold, around 74% were sold at Profit, 21% at loss & 3% at break even (where company made neither profit nor loss).
3. The top 5 countries with highest net sales are Unites States, Mexico, France, China, Australia. To conclude, the company should focus on Body care products & promote more offer in the top 5 countries to increase profits.
Sales & profit overview:
1. The top cities where maximum purchases are made is New York & Los Angeles.
2. The Profit Margin increase gradually form 2020-2022 but decline in 2023 to 5.76%.
3. The Profit & discount are negatively related to each other. As it can be seen on scatter plot, when discount is increasing throughout, company made some loss values.
4. The top 10 customers of the company are from various countries such as US, Italy, Brazil, Australia.
5. The Sales & discount also shows divergence where sales increases constantly & discount varies throughout the years. To Conclude, The strategy should be made to provide more offers to top 10 customers and more focus on maintaining a good discount strategy.
ZoomCharts visuals used
4U Report Challenges
Participate in data challenges, build and submit reports to get free template downloads.
Join CommunityMobile view allows you to interact with the report. To Download the template please switch to desktop view.

Was this helpful? Thank you for your feedback!
Sorry about that.
How can we improve it?