566
FP20 Analytics Challenge 10
FP20 Analytics Challenge 10
Report Author: Msingisi Ratshana
566
Share template with others
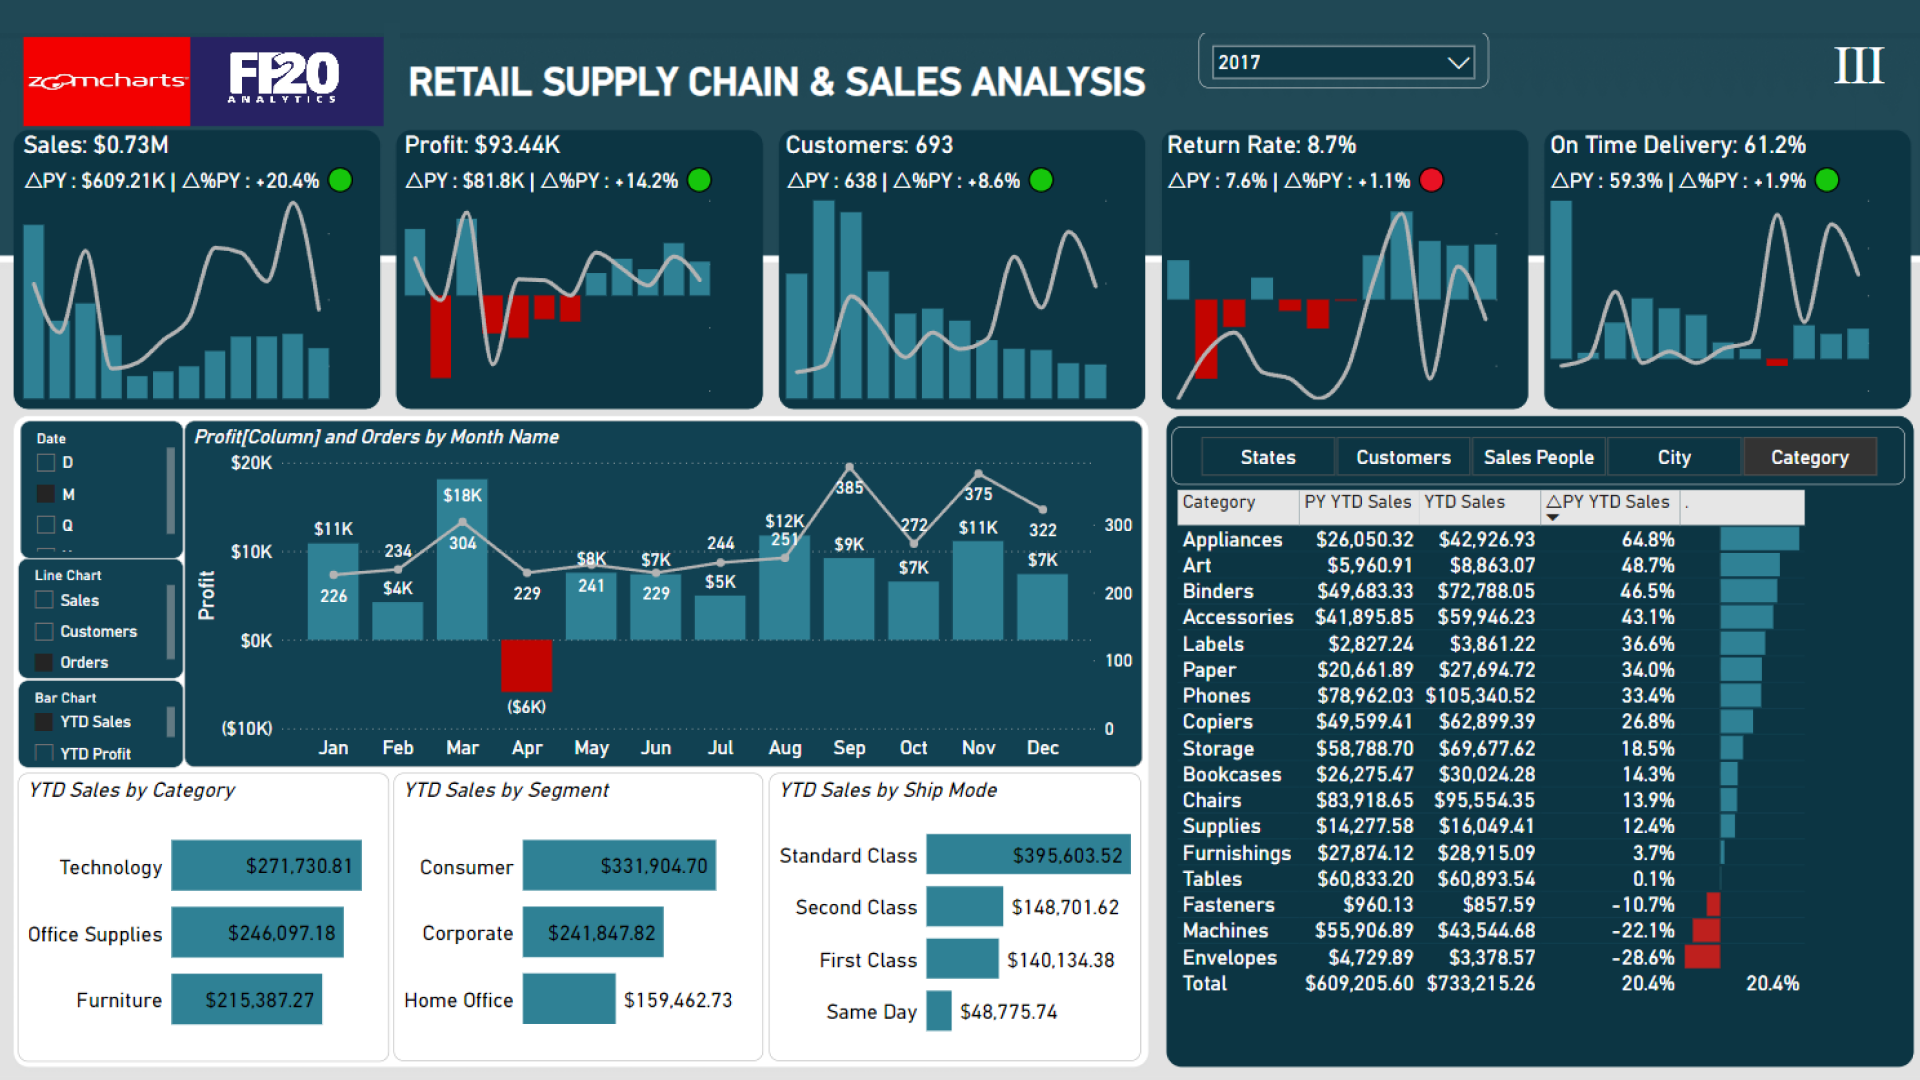
Report submitted for FP20 Analytics ZoomCharts Challenge, October 2023. The report was built with North America Retail Supply Chain and Sales Analysis dataset and includes ZoomCharts custom Drill Down PRO visuals for Power BI.
Author's description:
The report focuses on the various regions by looking at which states and which cities contributed to the total retail sales in that region. The full report also looks at the top 5 customers with respect to profit, it also focuses on returns, and the fastest growers, and provides an analysis of performance across product categories.
4U Report Challenges
Participate in data challenges, build and submit reports to get free template downloads.
Join CommunityMobile view allows you to interact with the report. To Download the template please switch to desktop view.
Was this helpful? Thank you for your feedback!
Sorry about that.
How can we improve it?