995
Financial Reporting & Analysis
Financial Reporting & Analysis
Report Author: Msingisi Ratshana
995
Share template with others
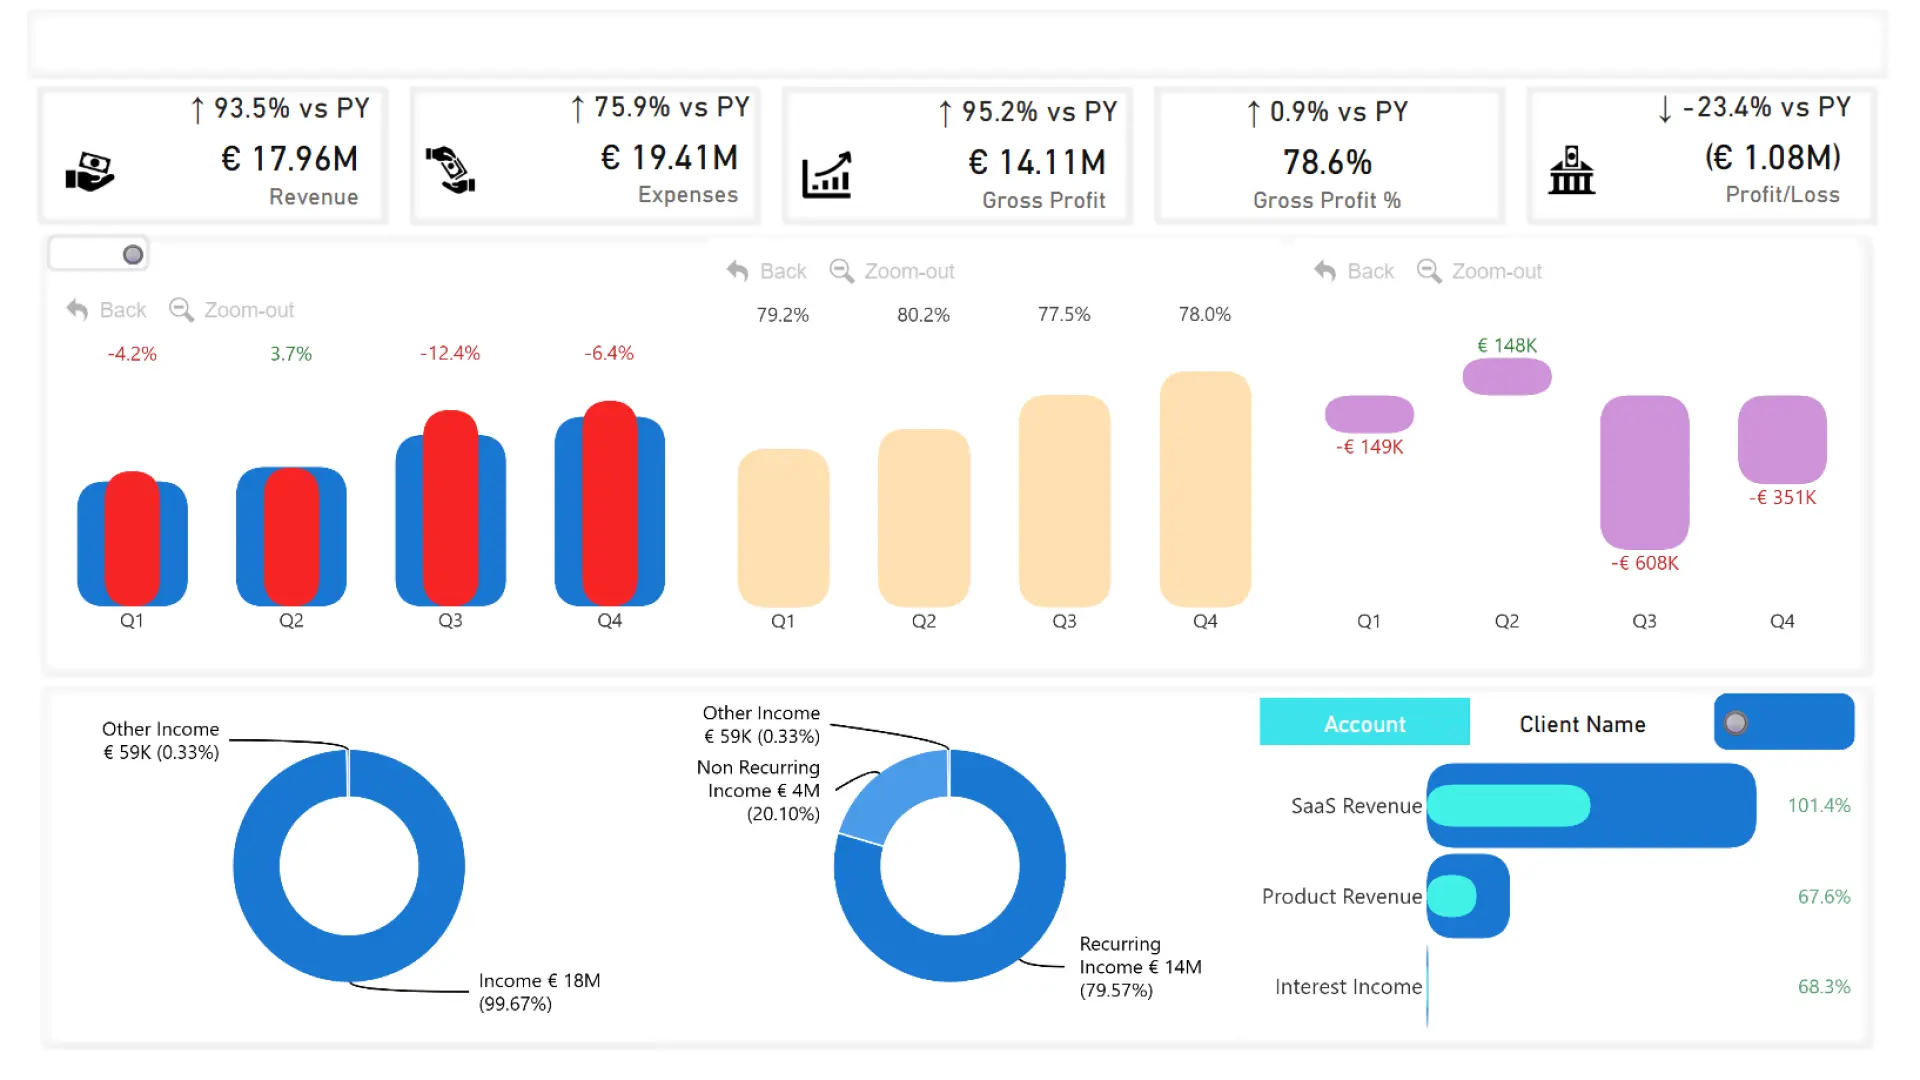
Report submitted for the FP20 Analytics ZoomCharts Challenge, May 2025. The report was built using the Financial Statements dataset Analysis Dataset and includes ZoomCharts custom Drill Down PRO visuals for Power BI.
Author's Description:
This project involved developing an interactive Power BI dashboard to analyze and monitor a company’s financial performance. The dashboard provides a comprehensive overview of revenue, expenses, gross profit, and net profit/loss with year-over-year and budget comparisons.
4U Report Challenges
Participate in data challenges, build and submit reports to get free template downloads.
Join CommunityMobile view allows you to interact with the report. To Download the template please switch to desktop view.


Was this helpful? Thank you for your feedback!
Sorry about that.
How can we improve it?