533
Financial Performance General Overview
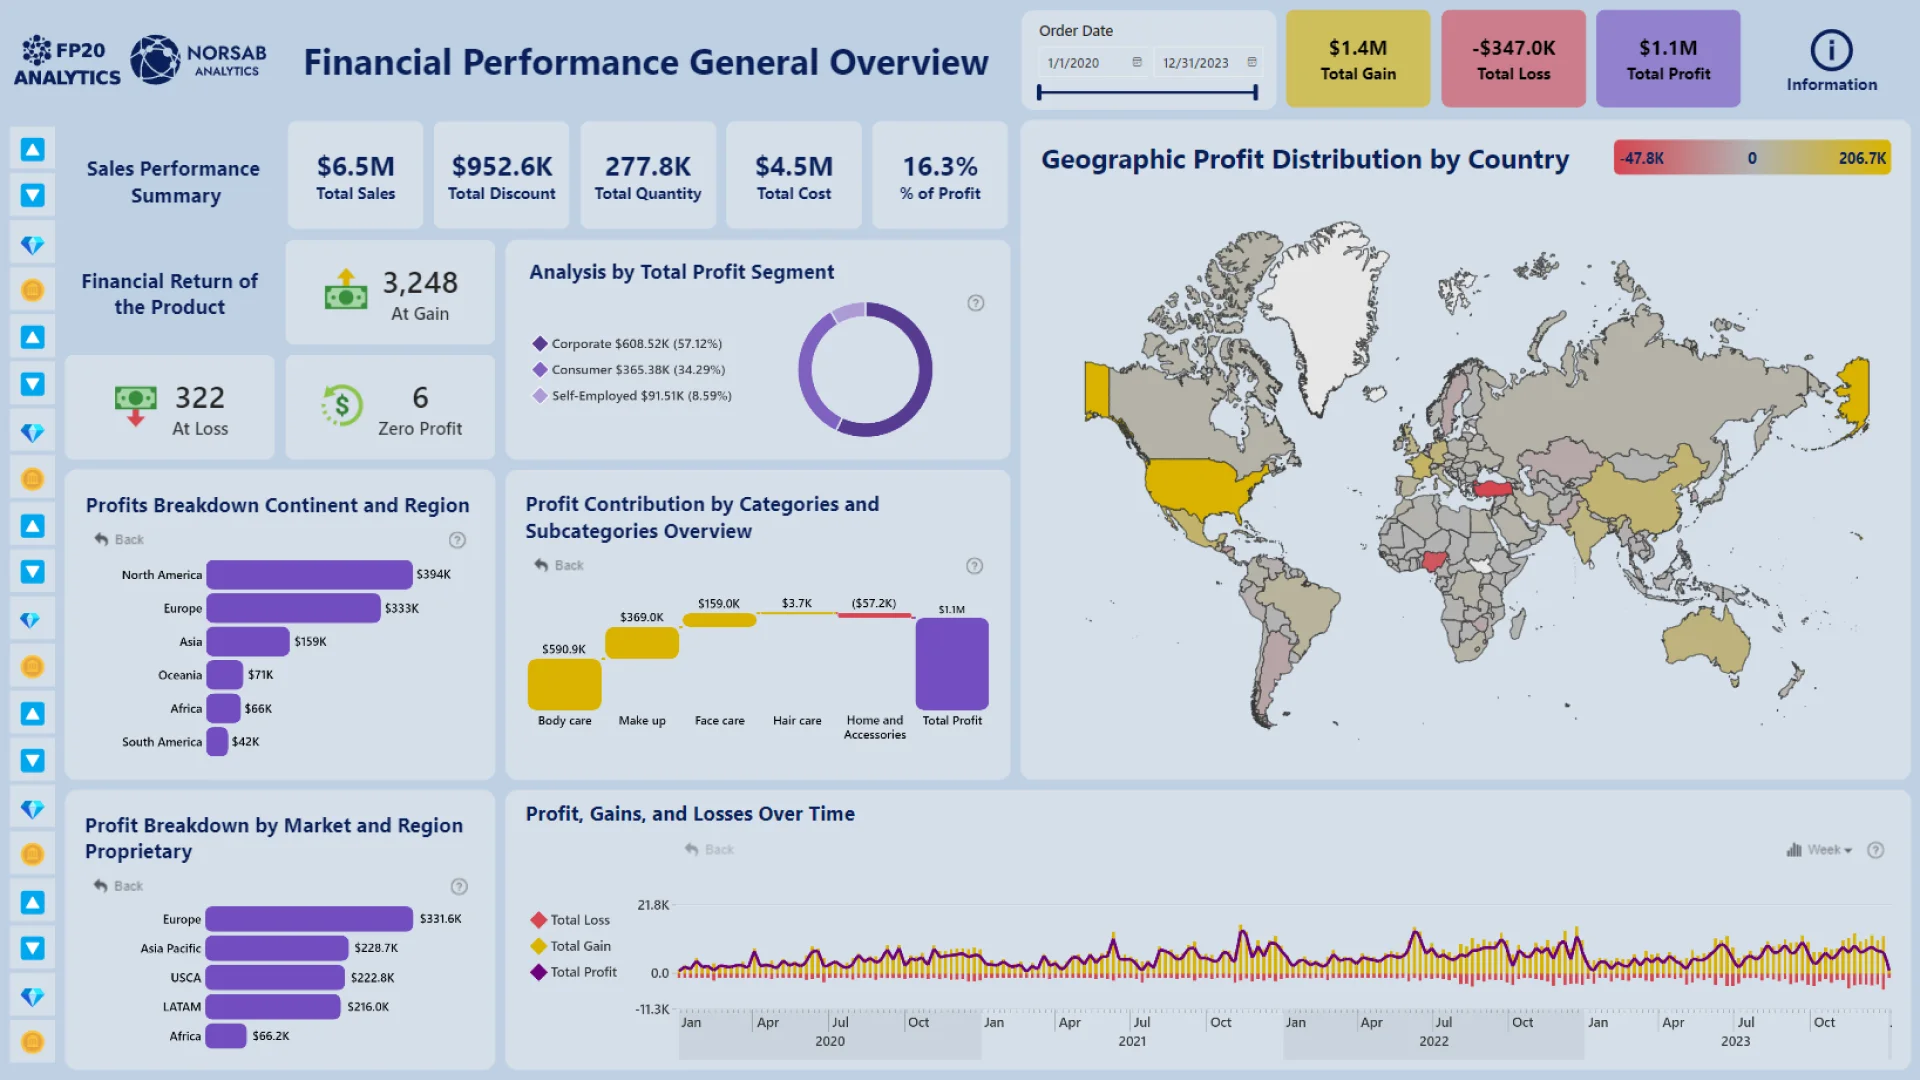
Financial Performance General Overview
Report Author: Norman Reynaldo Sabillon Castro
533
Share template with others
Report submitted for FP20 Analytics ZoomCharts Challenge 19 (September 2024). The report was built with the E-commerce KPI Analysis dataset and includes ZoomCharts custom Drill Down PRO visuals for Power BI.
Author's description:
I developed the "Financial Performance General Overview" report as an analytical tool to monitor and evaluate critical financial metrics, including total sales, discounts, costs, quantities, and profit percentages. This solution provides targeted insights into financial performance trends, enabling data-driven decisions to optimize business strategies and drive profitability.
ZoomCharts visuals used
4U Report Challenges
Participate in data challenges, build and submit reports to get free template downloads.
Join CommunityMobile view allows you to interact with the report. To Download the template please switch to desktop view.

Was this helpful? Thank you for your feedback!
Sorry about that.
How can we improve it?