1109
Employee Performance & Productivity Analysis 2
Employee Performance & Productivity Analysis 2
More Report pages
Report Author: Akshay Waghavakar
1109
Share template with others
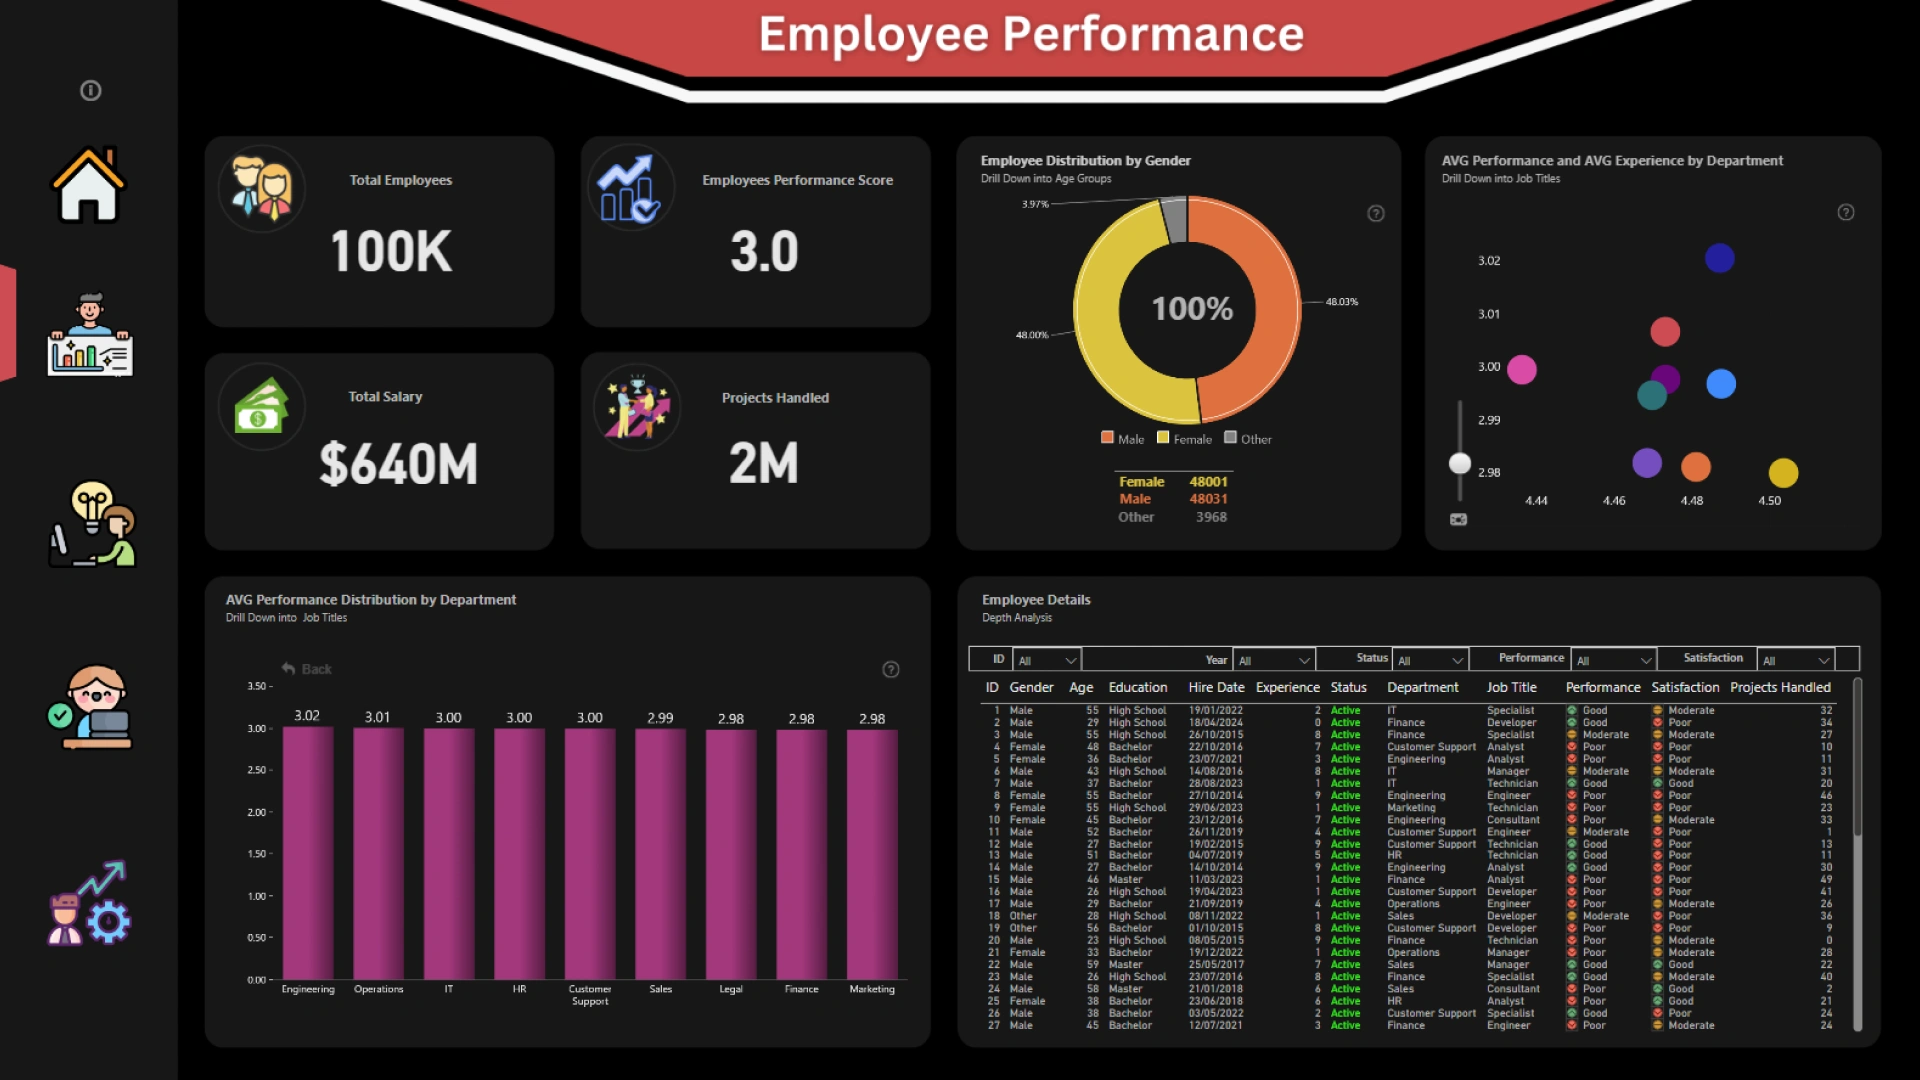
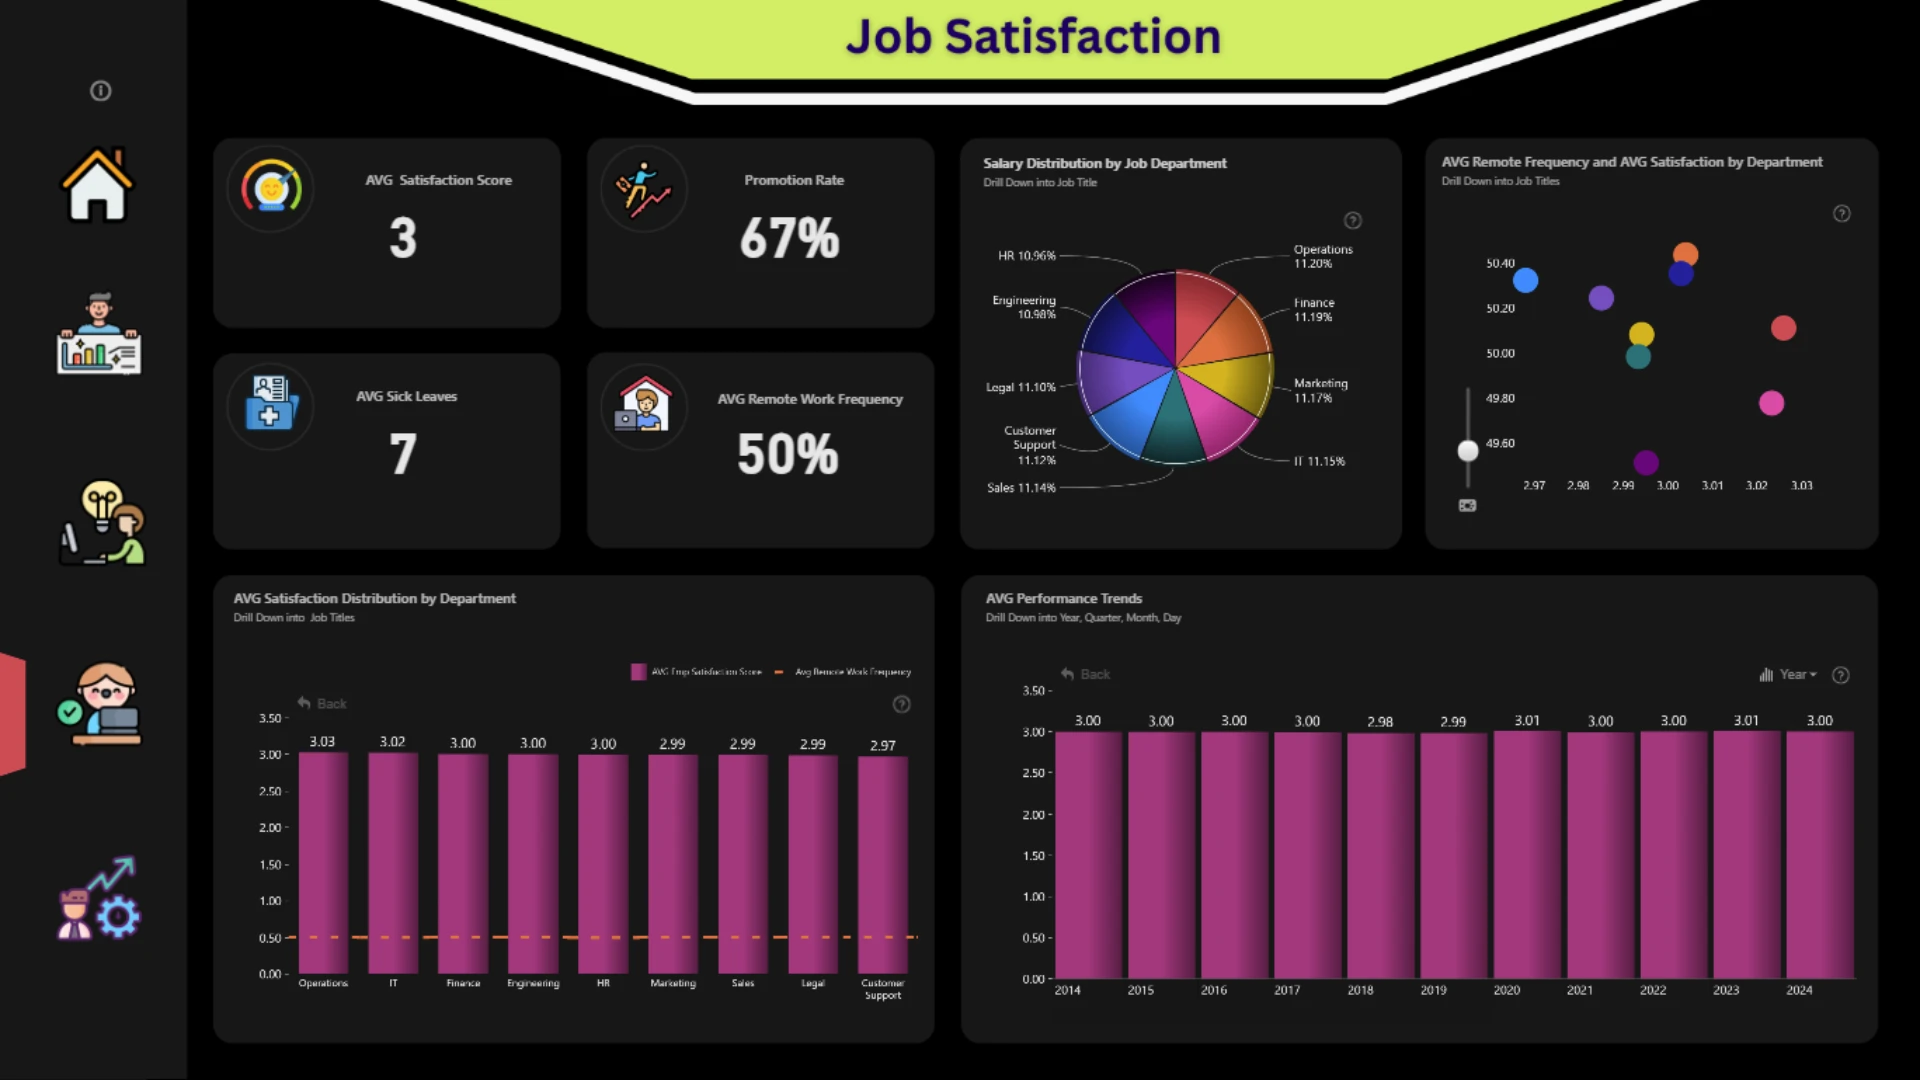
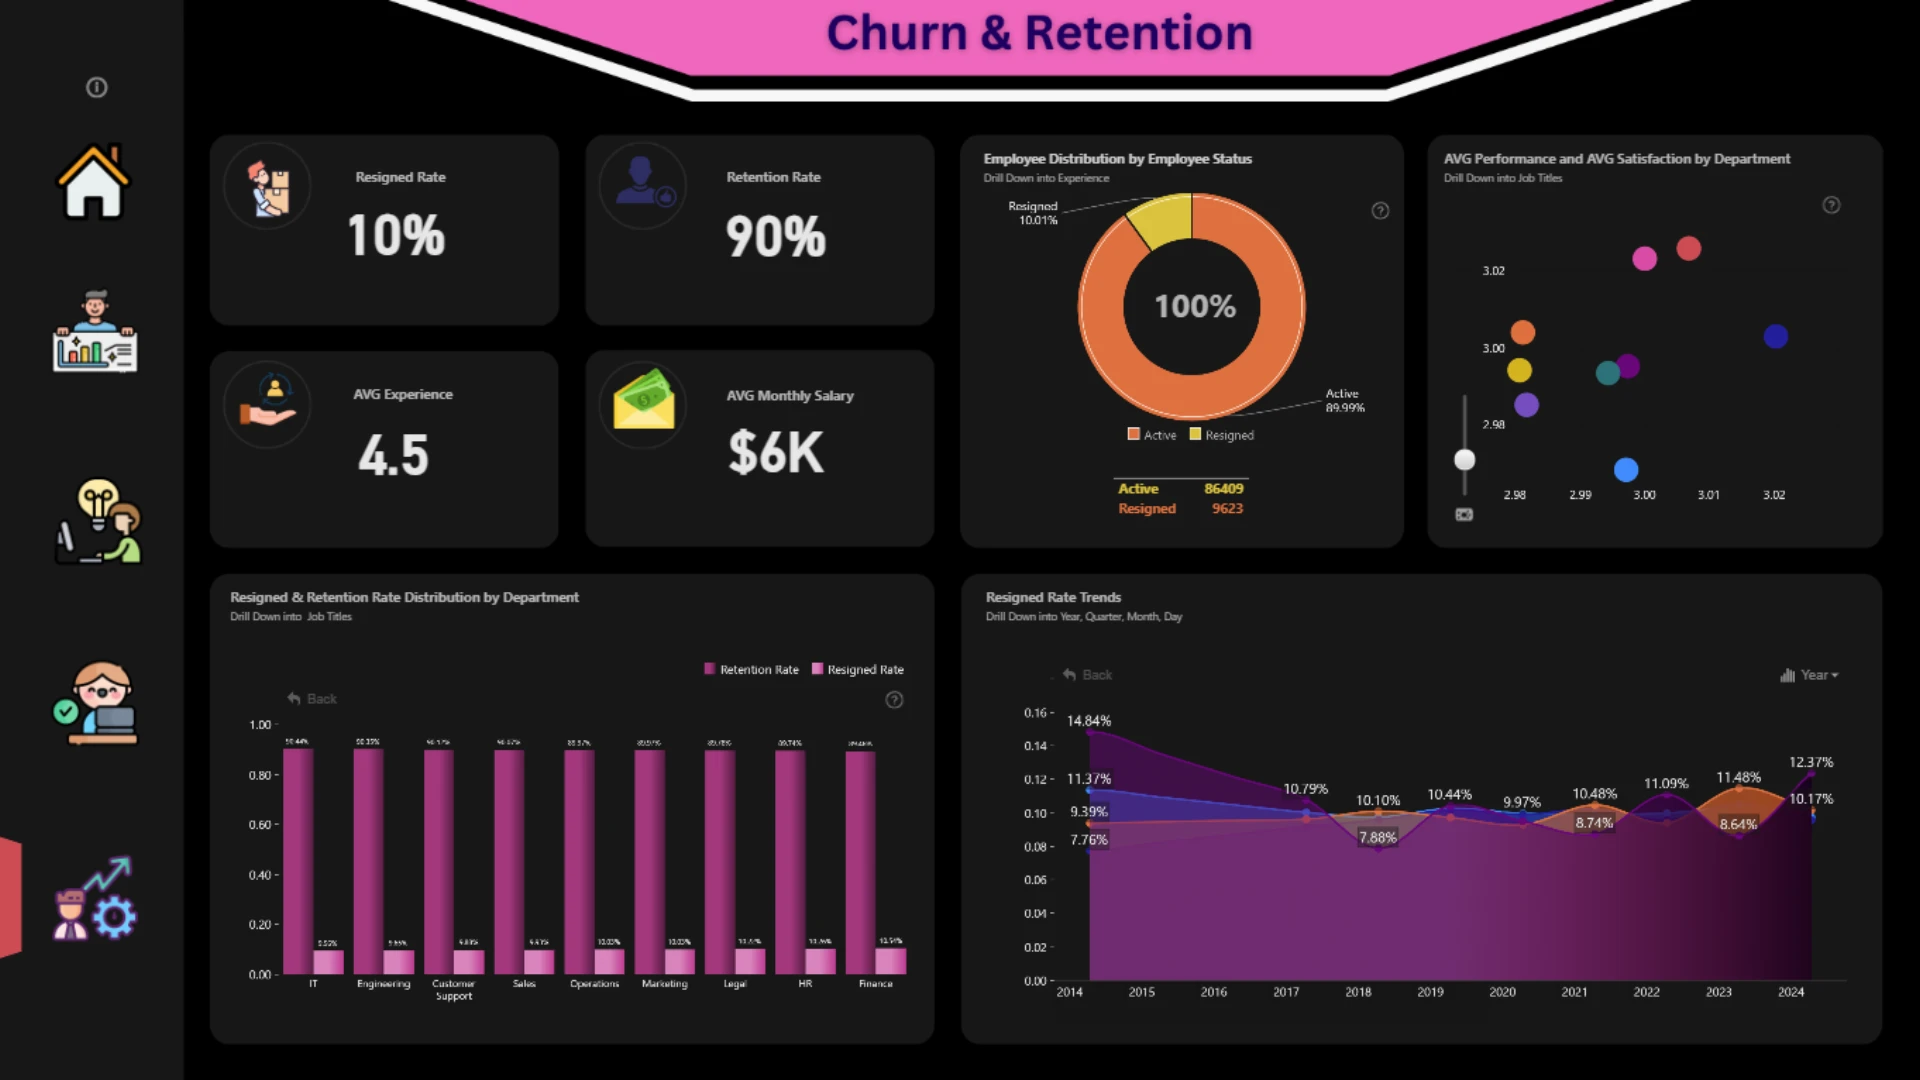
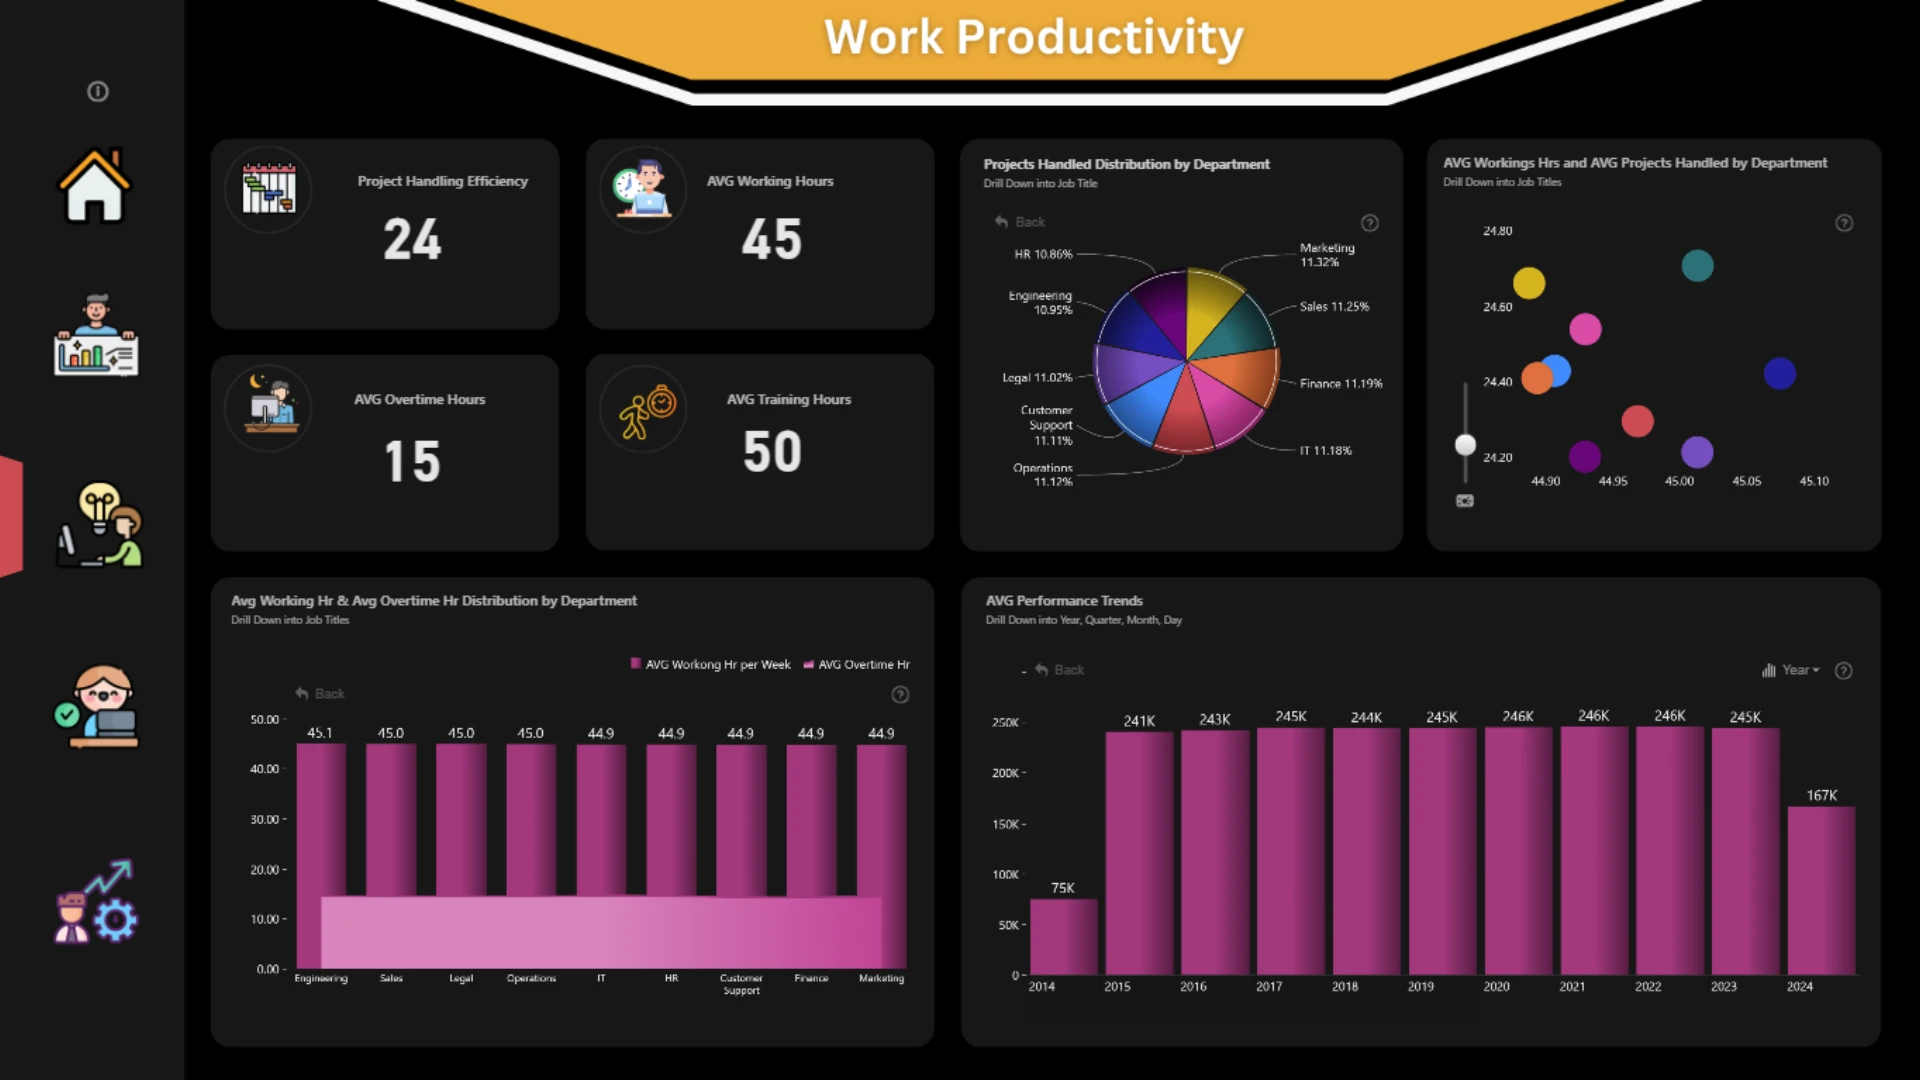
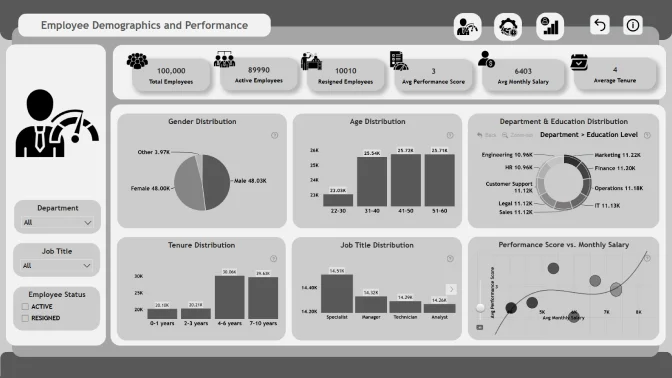
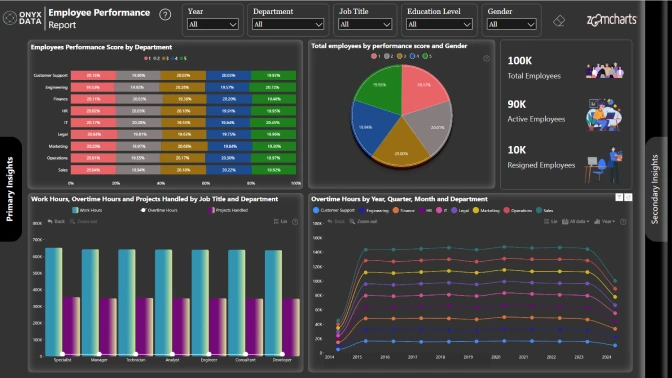
Report submitted for Onyx Data DataDNA ZoomCharts Mini Challenge, October 2024. The report was built based on Employee Performance dataset and includes ZoomCharts custom Drill Down PRO visuals for Power BI.
Author's description:
This comprehensive report delivers valuable insights for HR teams to better understand employee performance, productivity, satisfaction, and retention trends. Key Project Highlights:
Data Transformation & Modeling: Cleaned, structured, and modeled the data for effective analysis.
DAX Calculations: Applied advanced calculations to extract meaningful performance and productivity metrics.
Power BI Service: Published the report for easy access and decision-making.
SQL Validation: Ensured accuracy and integrity of data through SQL validation.
What the Report Offers:
Performance Evaluation: Identifies top performers and areas needing support.
Productivity Metrics: Tracks work hours, project load, overtime, and team efficiency.
Job Satisfaction Trends: Analyzes satisfaction levels across departments and job titles.
Churn & Retention Prediction: Highlights potential resignation risks and offers strategies for employee retention.
This report is designed to help HR teams make informed, data-driven decisions that improve employee engagement and retention.
ZoomCharts visuals used





4U Report Challenges
Participate in data challenges, build and submit reports to get free template downloads.
Join CommunityMobile view allows you to interact with the report. To Download the template please switch to desktop view.
How to use a PBIX template
Preview the interactive report, download the PBIX file, open it in Power BI Desktop, and replace the same data connection with your own dataset.
Preview and download
Explore the report online and download the PBIX template file.
Open in Power BI Desktop
Open the downloaded PBIX file in Power BI Desktop.
Connect your data
Replace the sample data source with your own dataset.
Refresh and adjust
Refresh the model and update fields or visual were needed.
Save and share
Save your report and publish it for your audience.


