712
Employee Performance HR Report 3
Employee Performance HR Report 3
More Report pages
Report Author: Yash Wagh
712
Share template with others
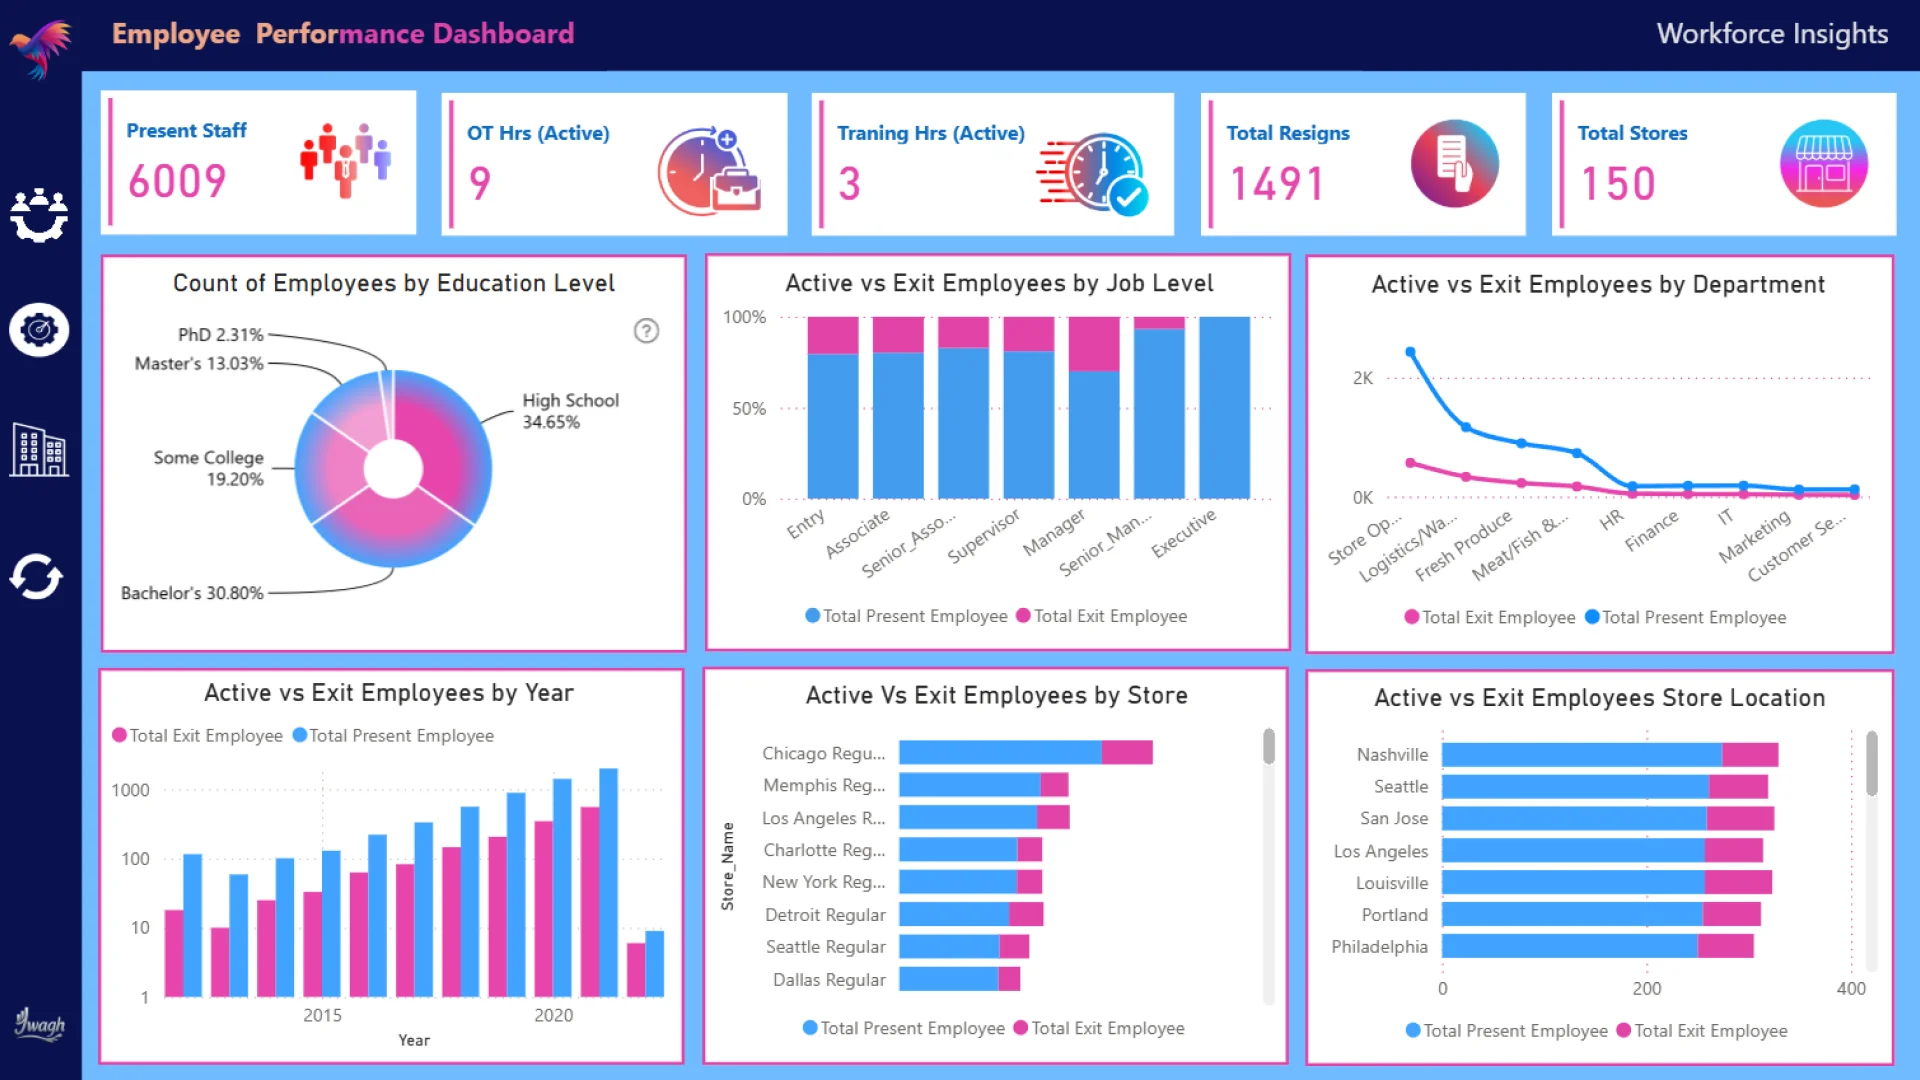
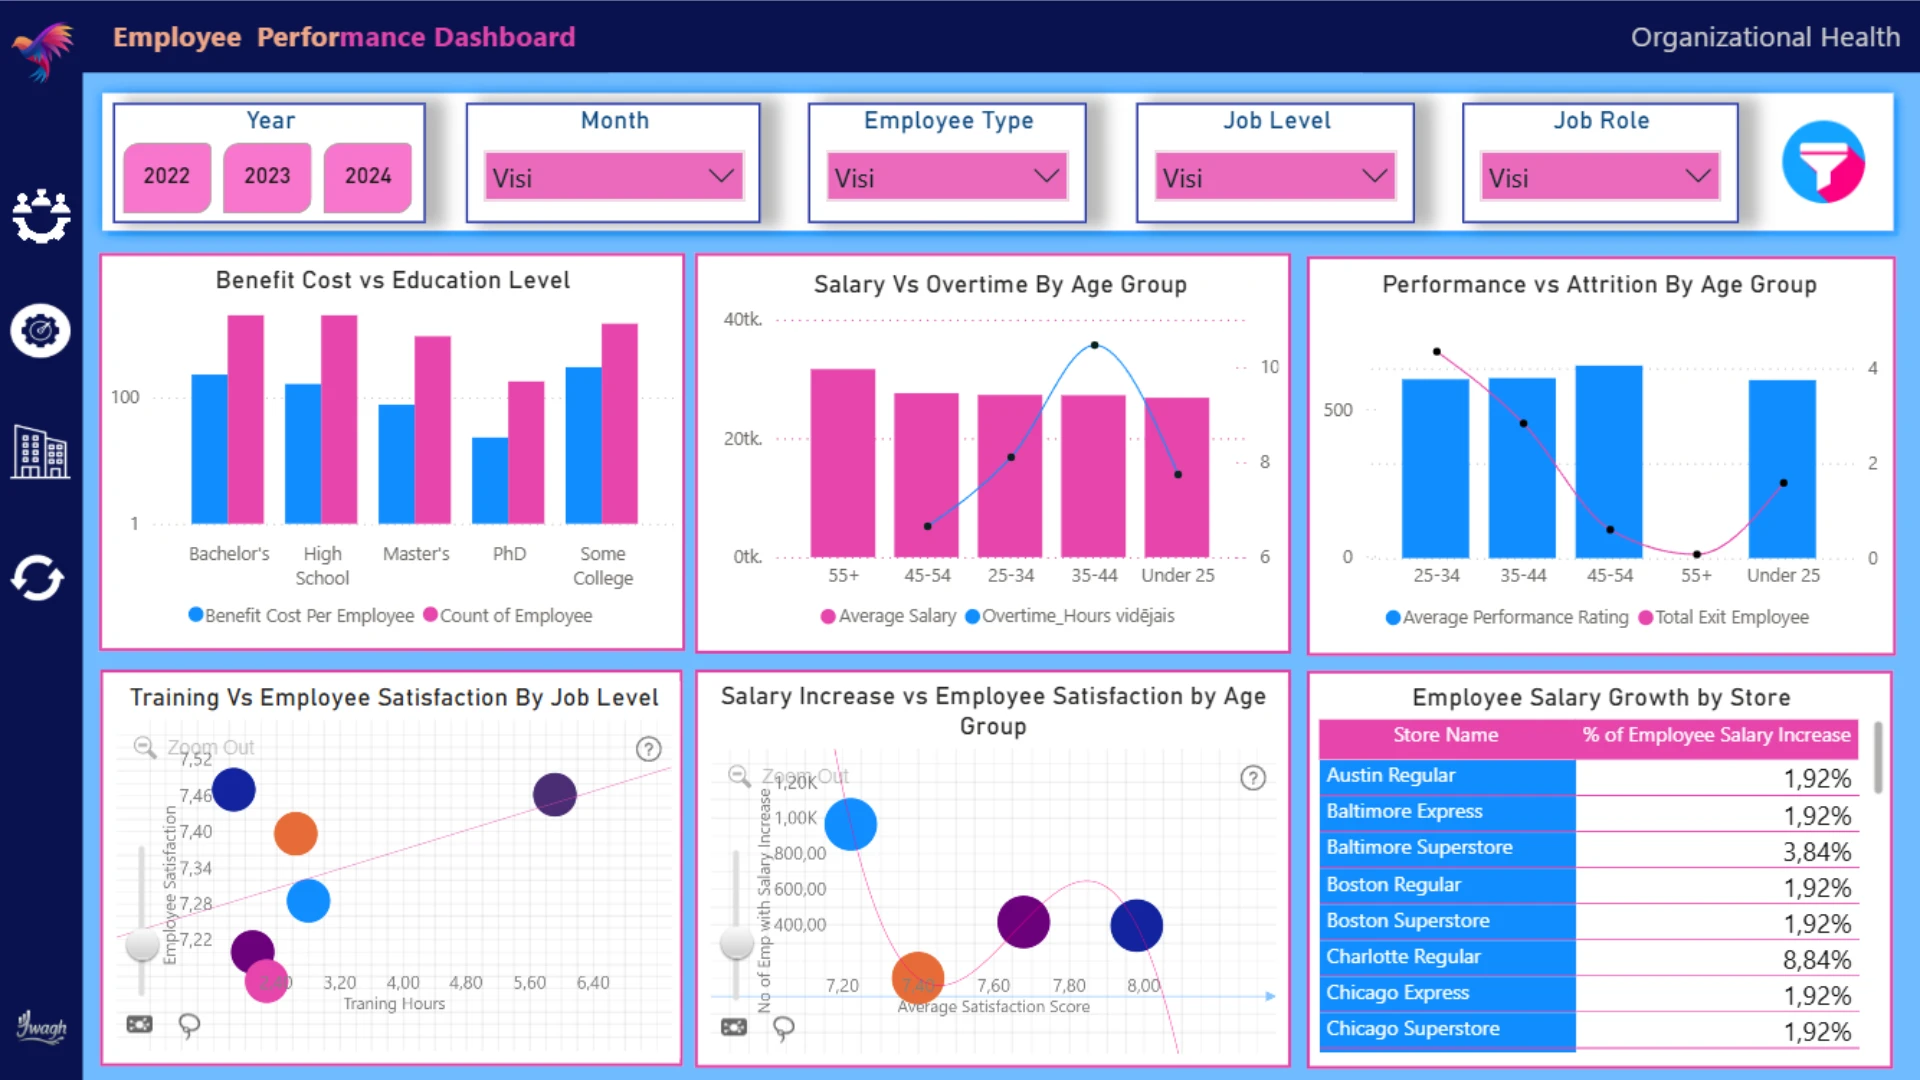
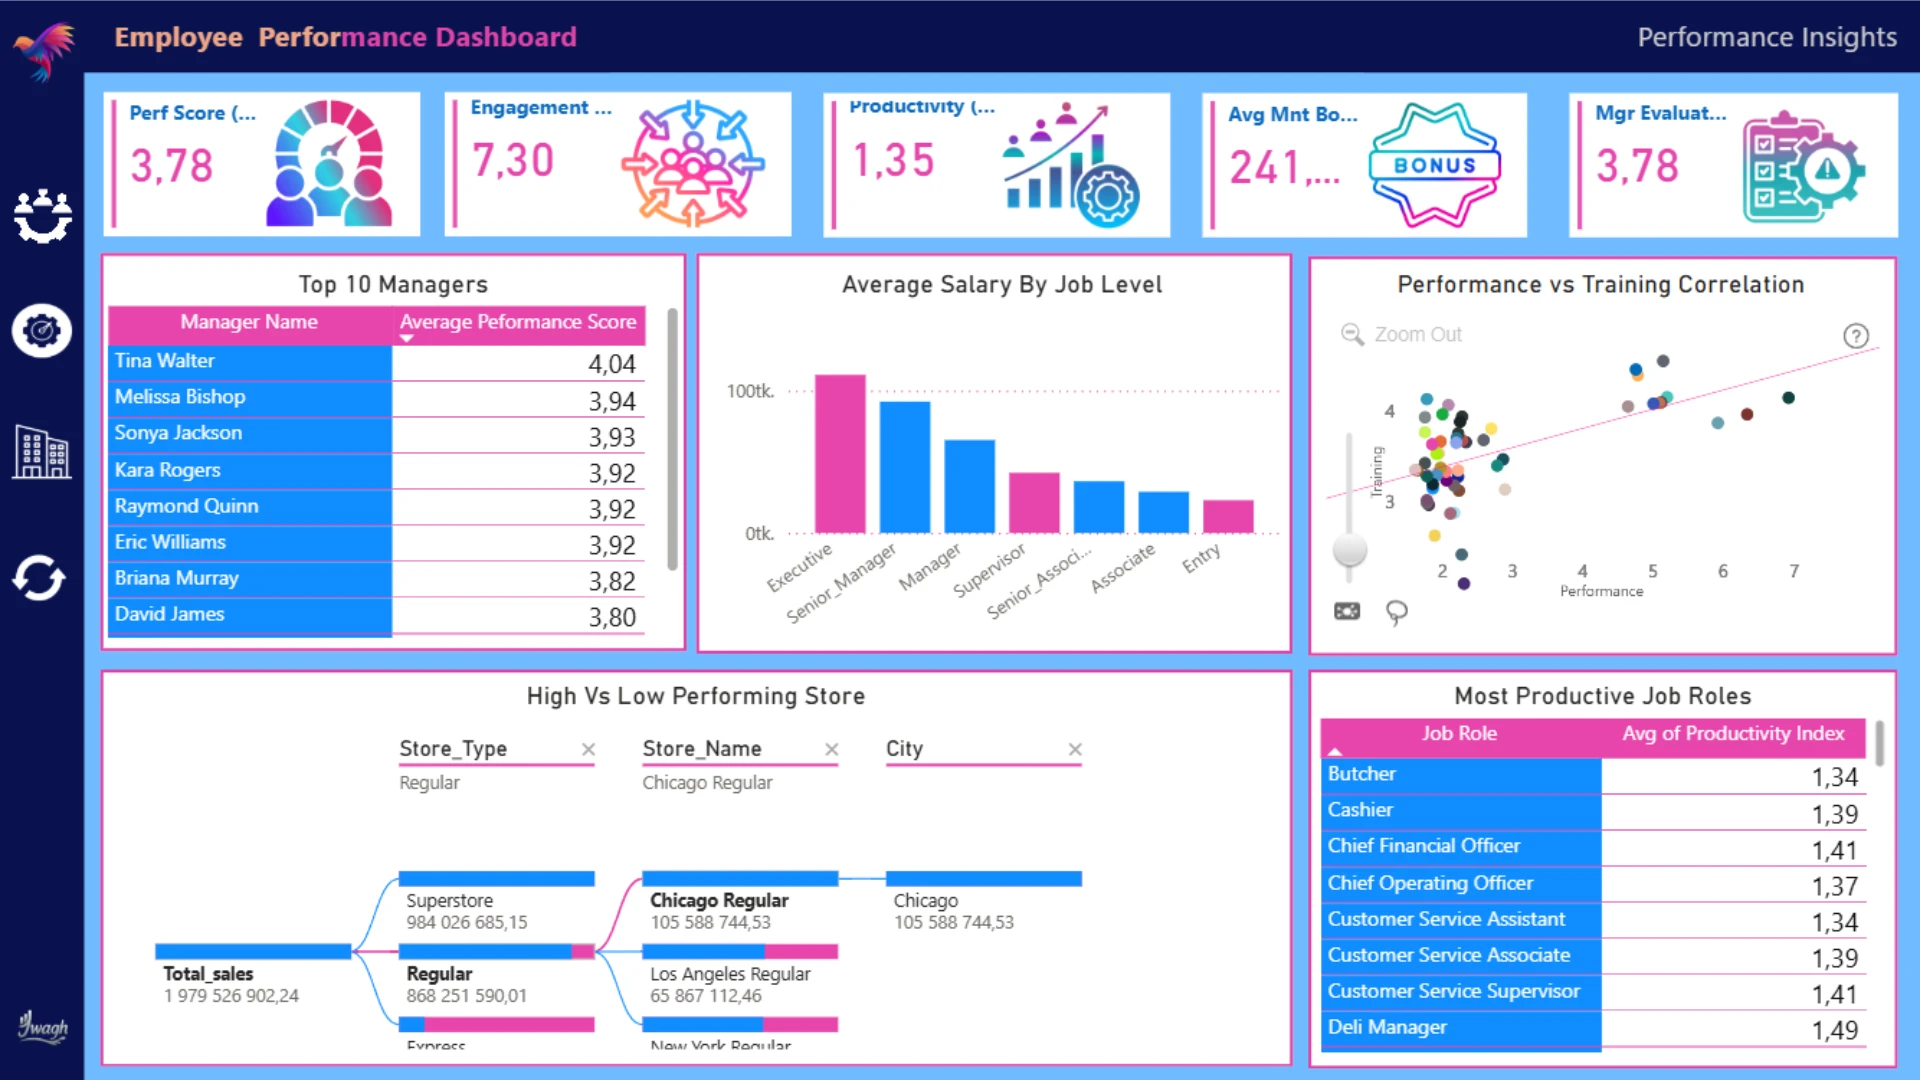
This Power BI report uses the Employee Performance HR dataset and features ZoomCharts Drill Down PRO custom visuals for Power BI. It was submitted to the FP20 Analytics ZoomCharts Data Challenge 30 in September 2025.
Author's Description:
Dashboard provides actionable insights across: Workforce (staff count, education levels, resignations, store-wise trends) Performance (manager evaluations, productivity index, training-performance link) Organizational Health (salary vs. overtime by age, attrition, satisfaction with salary growth). The report combines data visualization, DAX, and storytelling to support better HR decision-making and organizational strategy
4U Report Challenges
Participate in data challenges, build and submit reports to get free template downloads.
Join CommunityMobile view allows you to interact with the report. To Download the template please switch to desktop view.


Was this helpful? Thank you for your feedback!
Sorry about that.
How can we improve it?