2452
Employee Performance Analysis 4
Employee Performance Analysis 4
More Report pages
Report Author: Nina Ikpe
2452
Share template with others
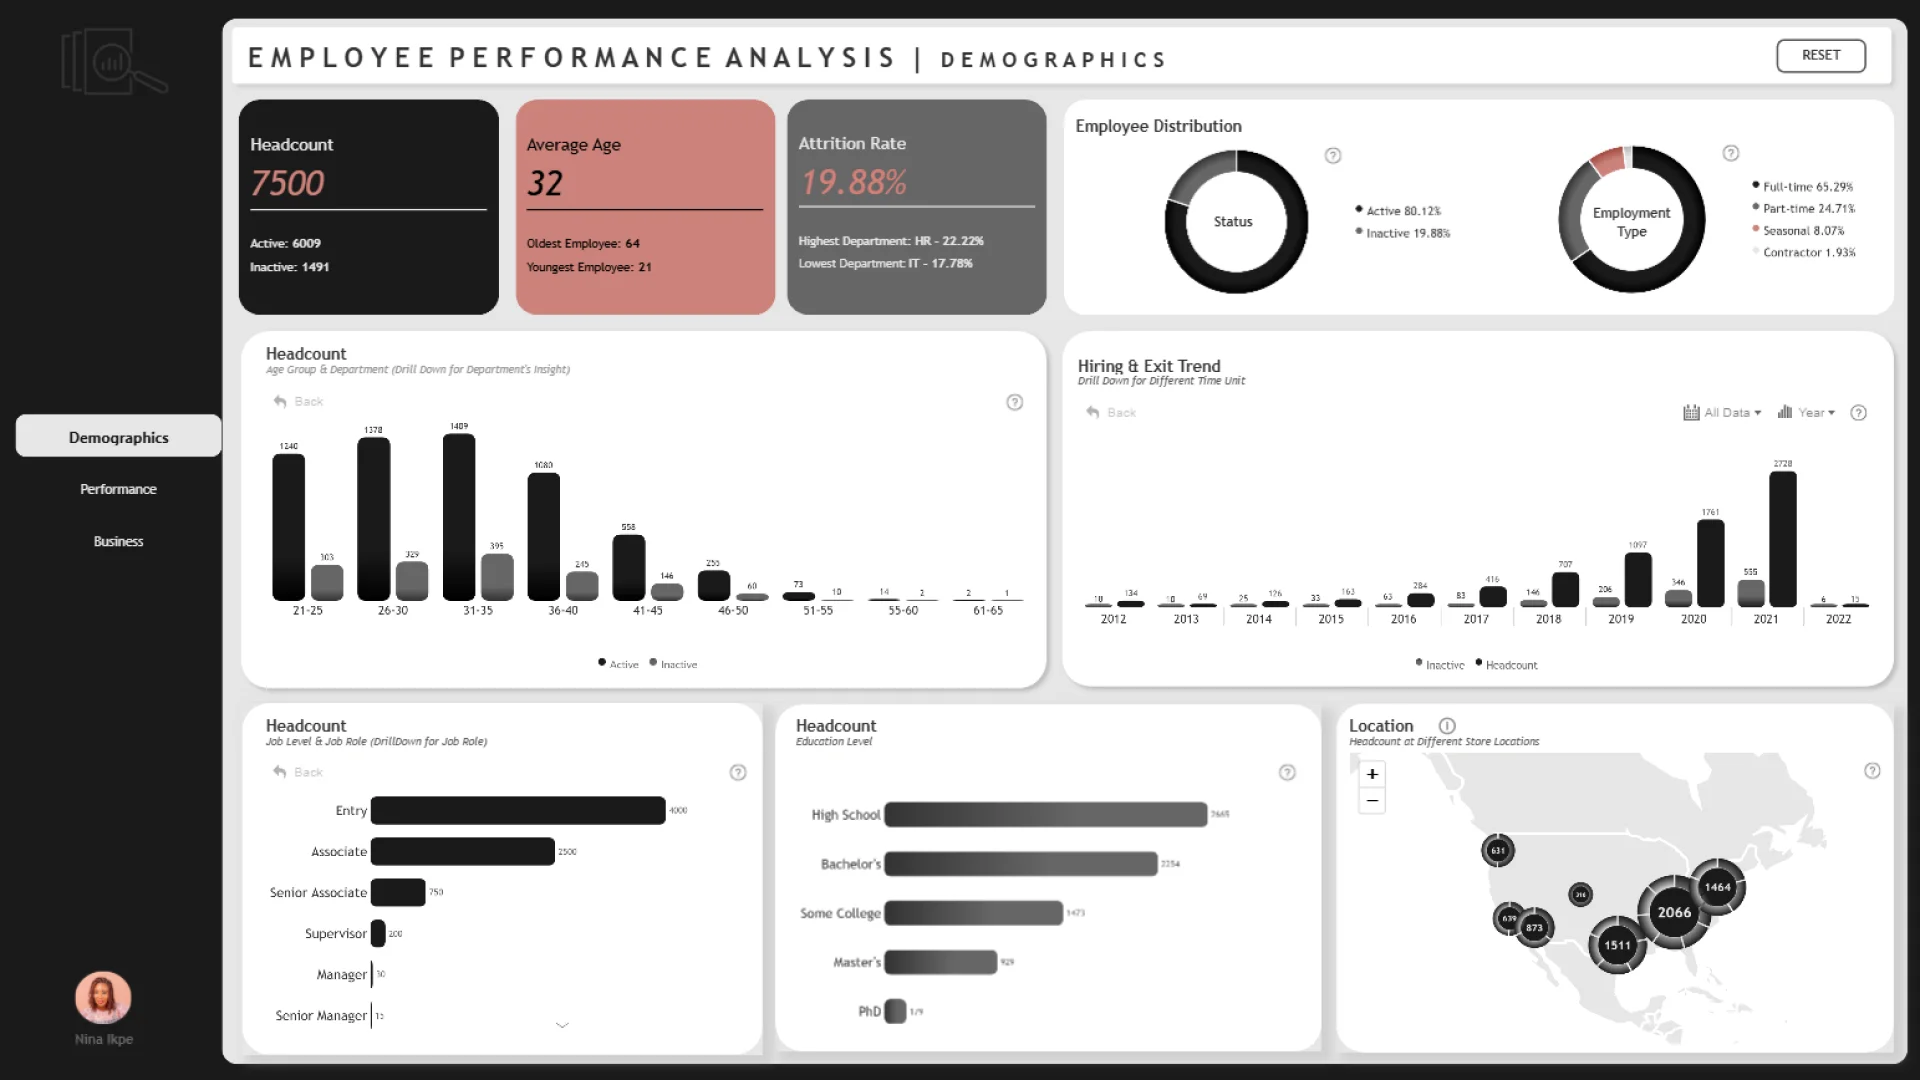
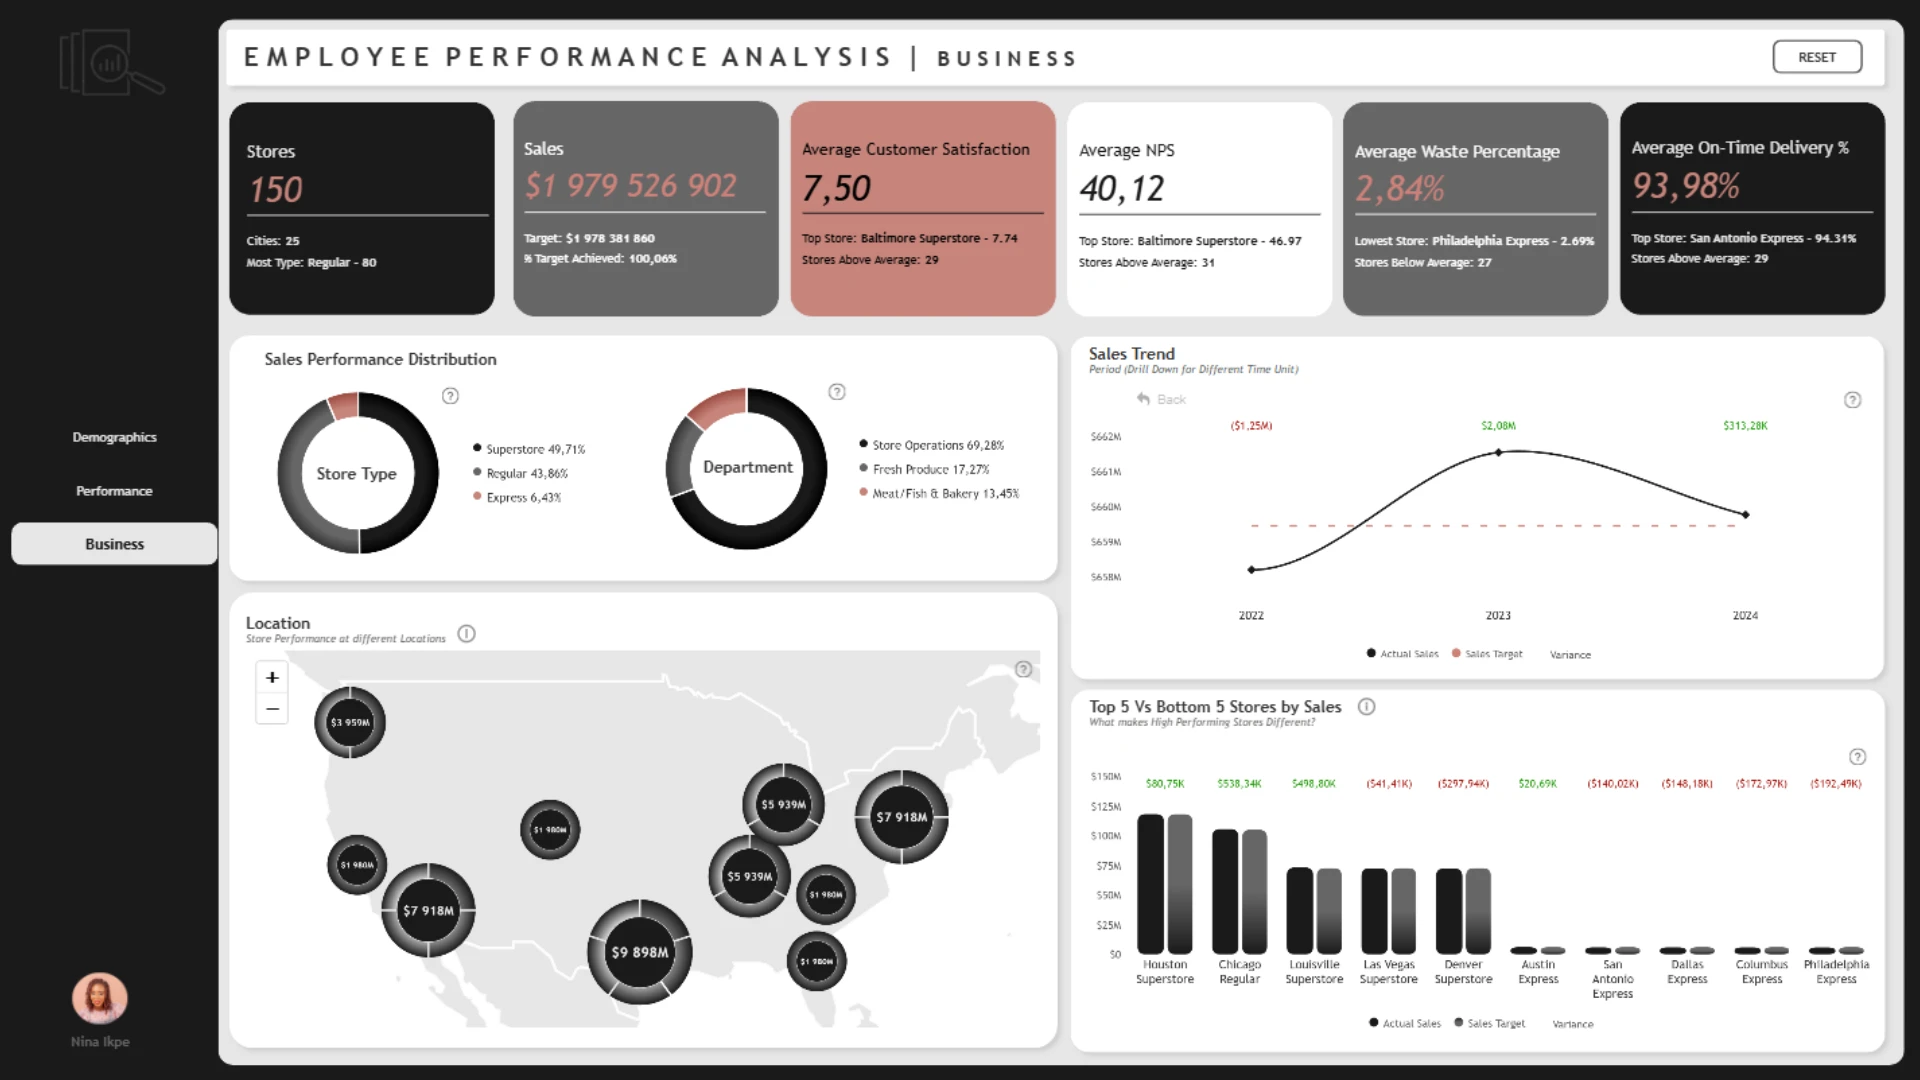
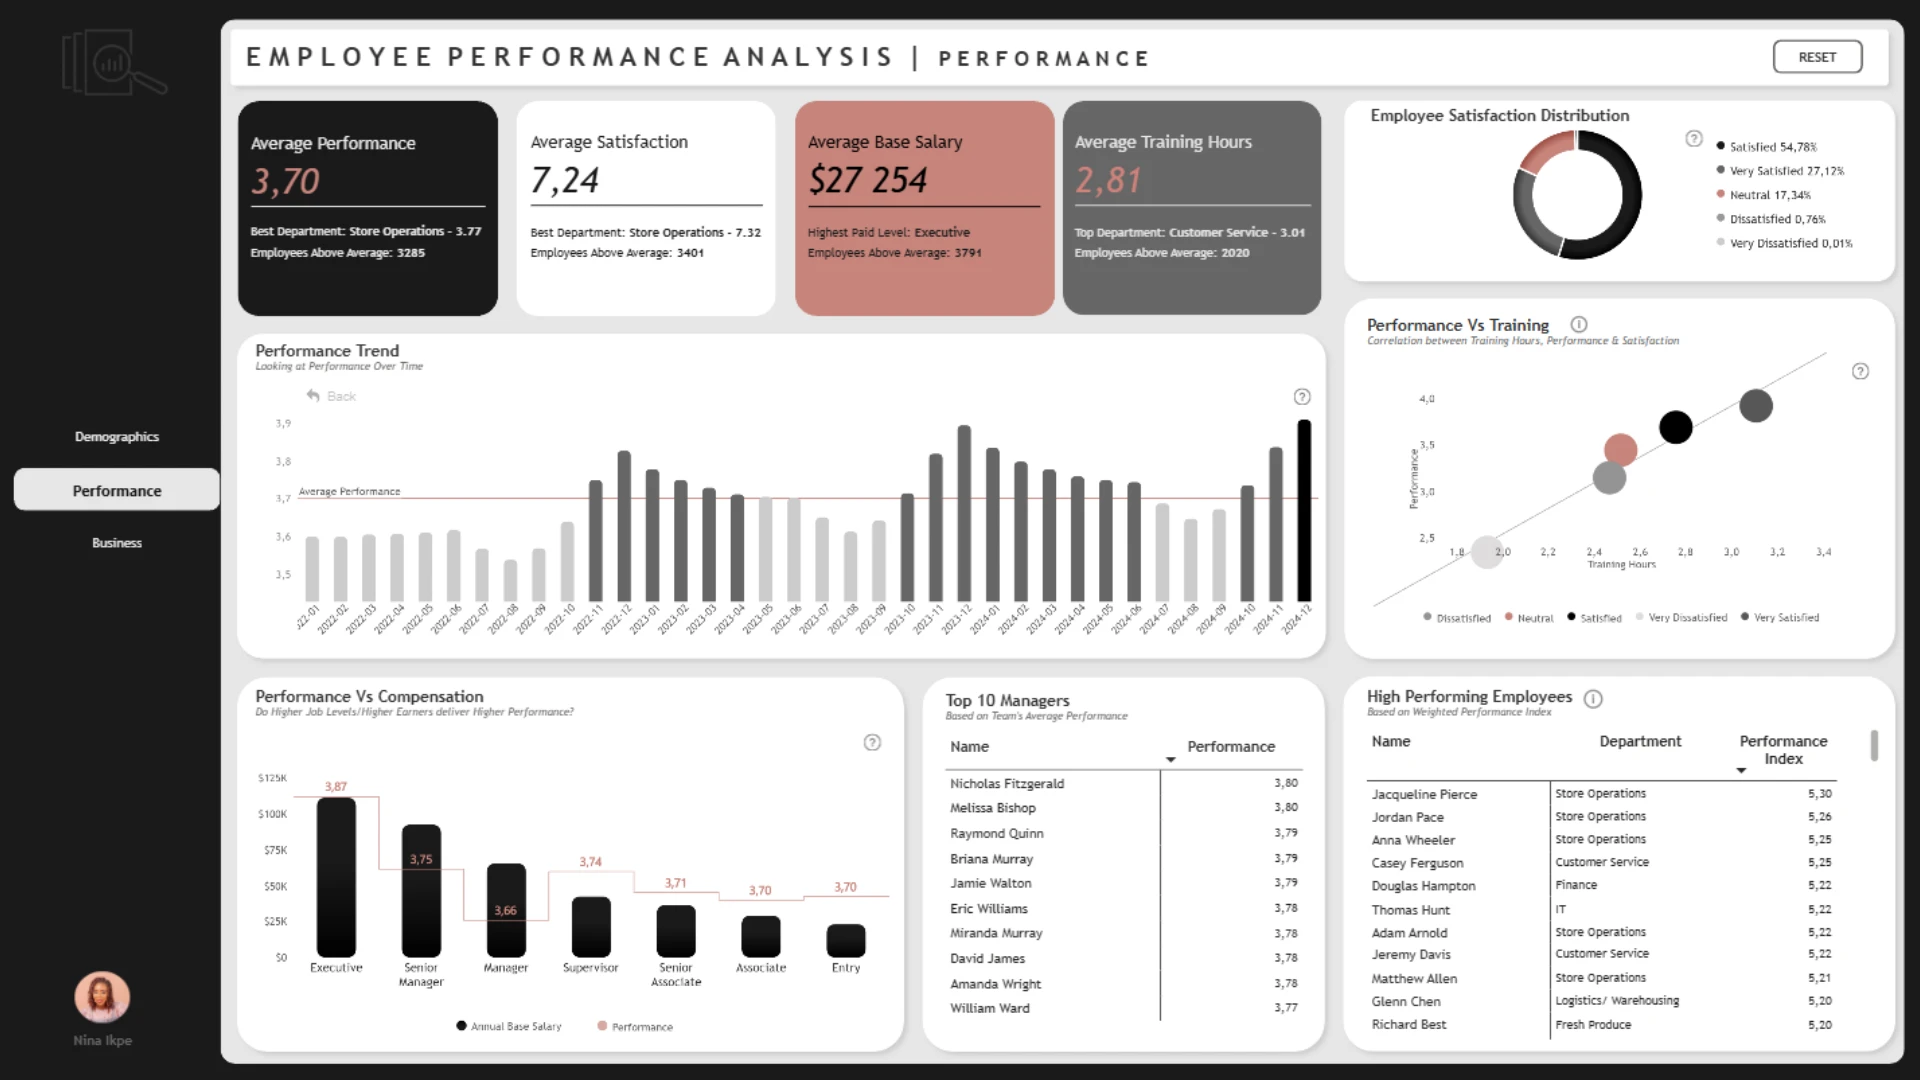
This Power BI report uses the Employee Performance HR dataset and features ZoomCharts Drill Down PRO custom visuals for Power BI. It was submitted to the FP20 Analytics ZoomCharts Data Challenge 30 in September 2025.
Author's Description:
For the FP20 Analytics Challenge 30, I took on the role of an HR data analyst, exploring over 497,000 employee performance records to uncover workforce patterns and actionable insights. The report answers key questions on workforce makeup, performance, productivity drivers, high-performer traits, and the business impact of workforce dynamics. I used a minimalistic black-and-white design with subtle color accents for clarity and ease of navigation.
ZoomCharts visuals used






4U Report Challenges
Participate in data challenges, build and submit reports to get free template downloads.
Join CommunityMobile view allows you to interact with the report. To Download the template please switch to desktop view.
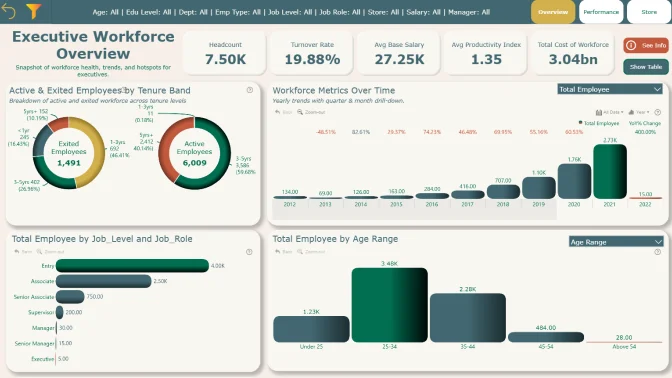
How to use a PBIX template
Preview the interactive report, download the PBIX file, open it in Power BI Desktop, and replace the same data connection with your own dataset.
Preview and download
Explore the report online and download the PBIX template file.
Open in Power BI Desktop
Open the downloaded PBIX file in Power BI Desktop.
Connect your data
Replace the sample data source with your own dataset.
Refresh and adjust
Refresh the model and update fields or visual were needed.
Save and share
Save your report and publish it for your audience.


