919
Employee Performance Analysis 11
Employee Performance Analysis 11
Report Author: Tanmoy Banerjee
919
Share template with others
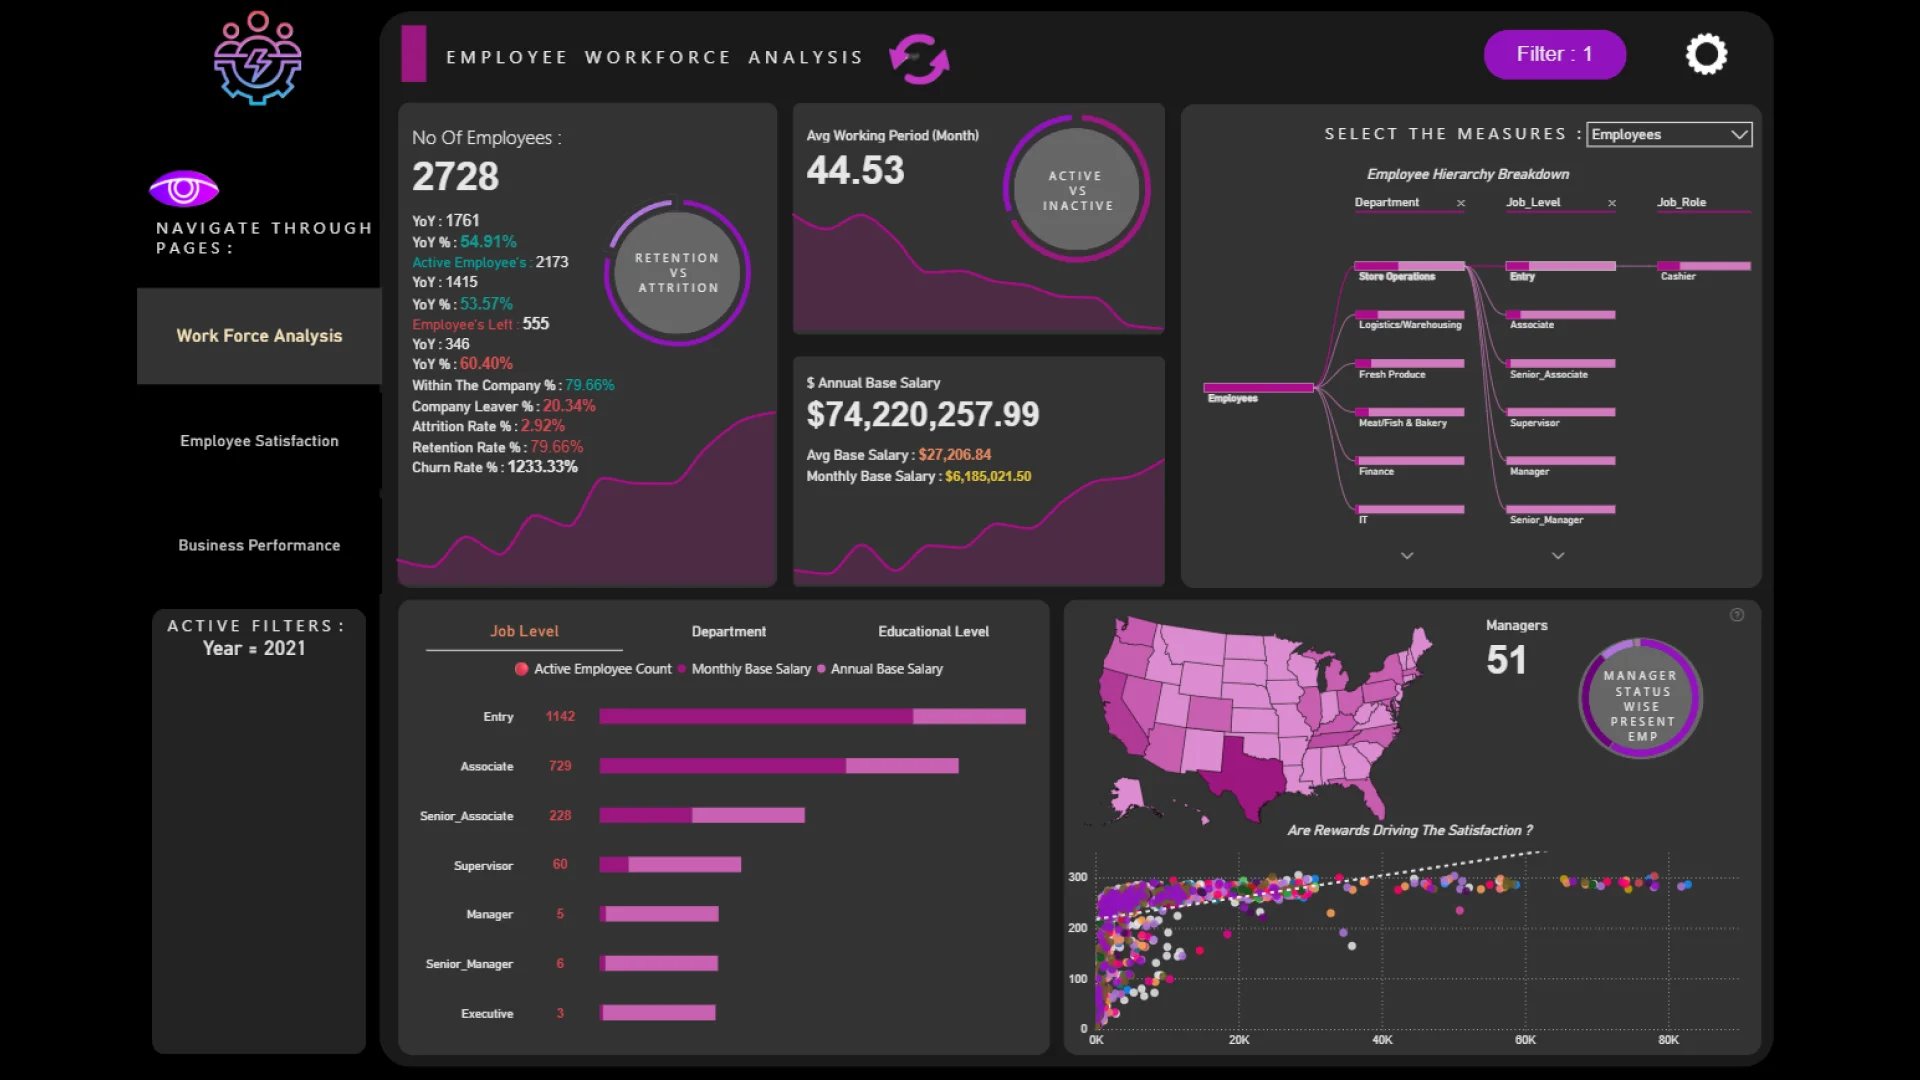
This Power BI report uses the Employee Performance HR dataset and features ZoomCharts Drill Down PRO custom visuals for Power BI. It was submitted to the FP20 Analytics ZoomCharts Data Challenge 30 in September 2025.
Author's Description:
Employee satisfaction is steady at 7.2–7.5, with strong links to manager evaluations and rewards. Training supports higher performance, while excessive overtime signals burnout risks. High performers (≥4.5) are key drivers of success, and their distribution highlights where best practices thrive. Overall, satisfied employees improve customer satisfaction and sales, but attrition at specific job levels underscores the need for stronger retention strategies.
4U Report Challenges
Participate in data challenges, build and submit reports to get free template downloads.
Join CommunityMobile view allows you to interact with the report. To Download the template please switch to desktop view.


Was this helpful? Thank you for your feedback!
Sorry about that.
How can we improve it?