534
Email Campaign Performance 2
Email Campaign Performance 2
Report Author: Akshay Waghavakar
534
Share template with others
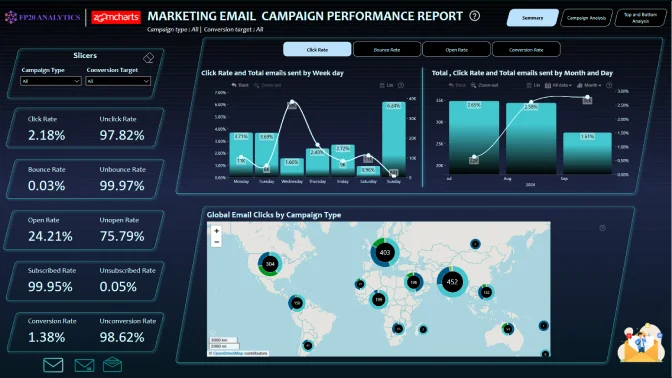
Report submitted for the FP20 Analytics ZoomCharts Challenge, October 2024. The report was built using the Marketing Email Campaign performance dataset and includes ZoomCharts custom Drill Down PRO visuals for Power BI.
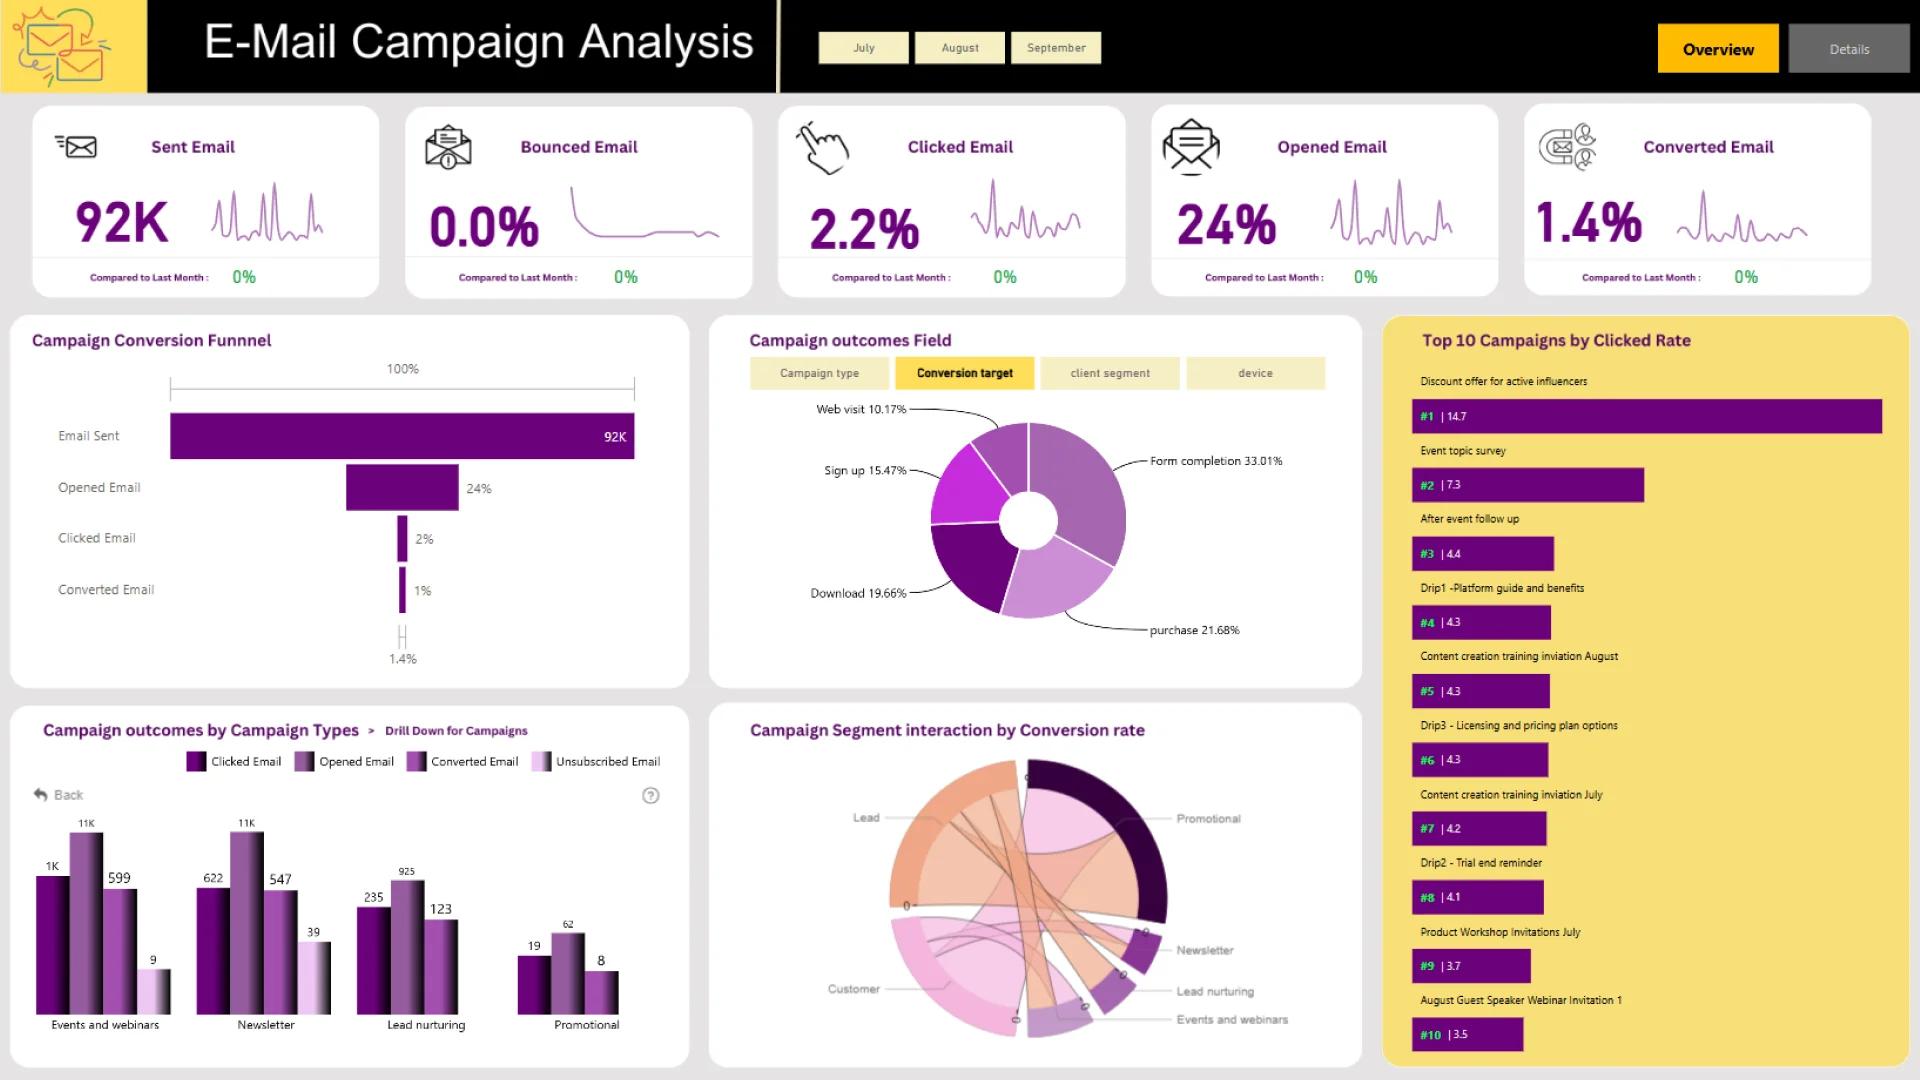
Author's description: This dashboard provides a deep dive into email campaign performance, offering insights into campaign effectiveness and strategic opportunities for optimization. Here's a quick summary of the key insights:
📈 Top Campaigns by Click Rate: Identifies the top 10 campaigns from July to September 2024 based on click rate, highlighting high-engagement campaigns.
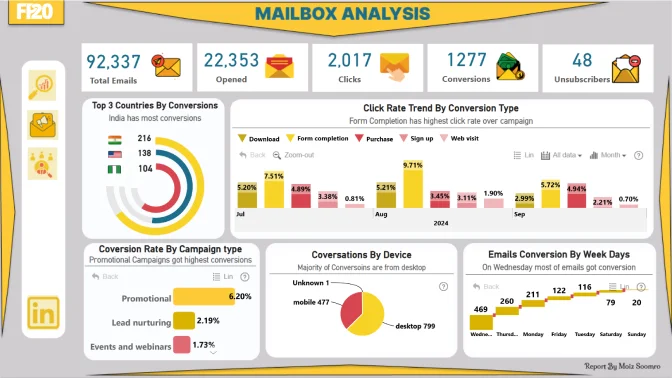
📊 Bounce and Unsubscribe Trends: Analyzes campaign types with the highest bounce rates over time and those with the lowest unsubscribe rates, offering critical insights for improving deliverability and engagement.
📉 Click Rate Trend by Conversation Type: Explores click rate trends over time across different conversation types to understand shifts in engagement.
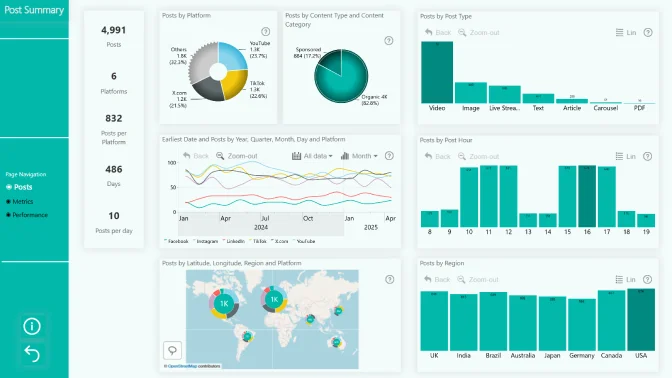
🗺 Geographic Performance: Displays campaign performance by country on a map, providing key metrics for quick geographic insights.
📱 Device Type Analysis: Examines how device types impact campaign performance, focusing on metrics like click and bounce rates by device.
🌍 Country-Specific Insights: Highlights the countries with the highest conversion rates in July and the lowest click rates in September campaigns.
💌 Email Domain Bounce Rates: Identifies client email domains with the highest bounce rates to optimize email deliverability.
📍 Opened Rate by Client Segment: Maps open rates by client segment across different regions.
ZoomCharts visuals used
4U Report Challenges
Participate in data challenges, build and submit reports to get free template downloads.
Join CommunityMobile view allows you to interact with the report. To Download the template please switch to desktop view.
Was this helpful? Thank you for your feedback!
Sorry about that.
How can we improve it?