863
Email Campaign Analysis Report By Abhijeet Pathak
Email Campaign Analysis Report By Abhijeet Pathak
Report Author: Abhijeet Pathak
863
Share template with others
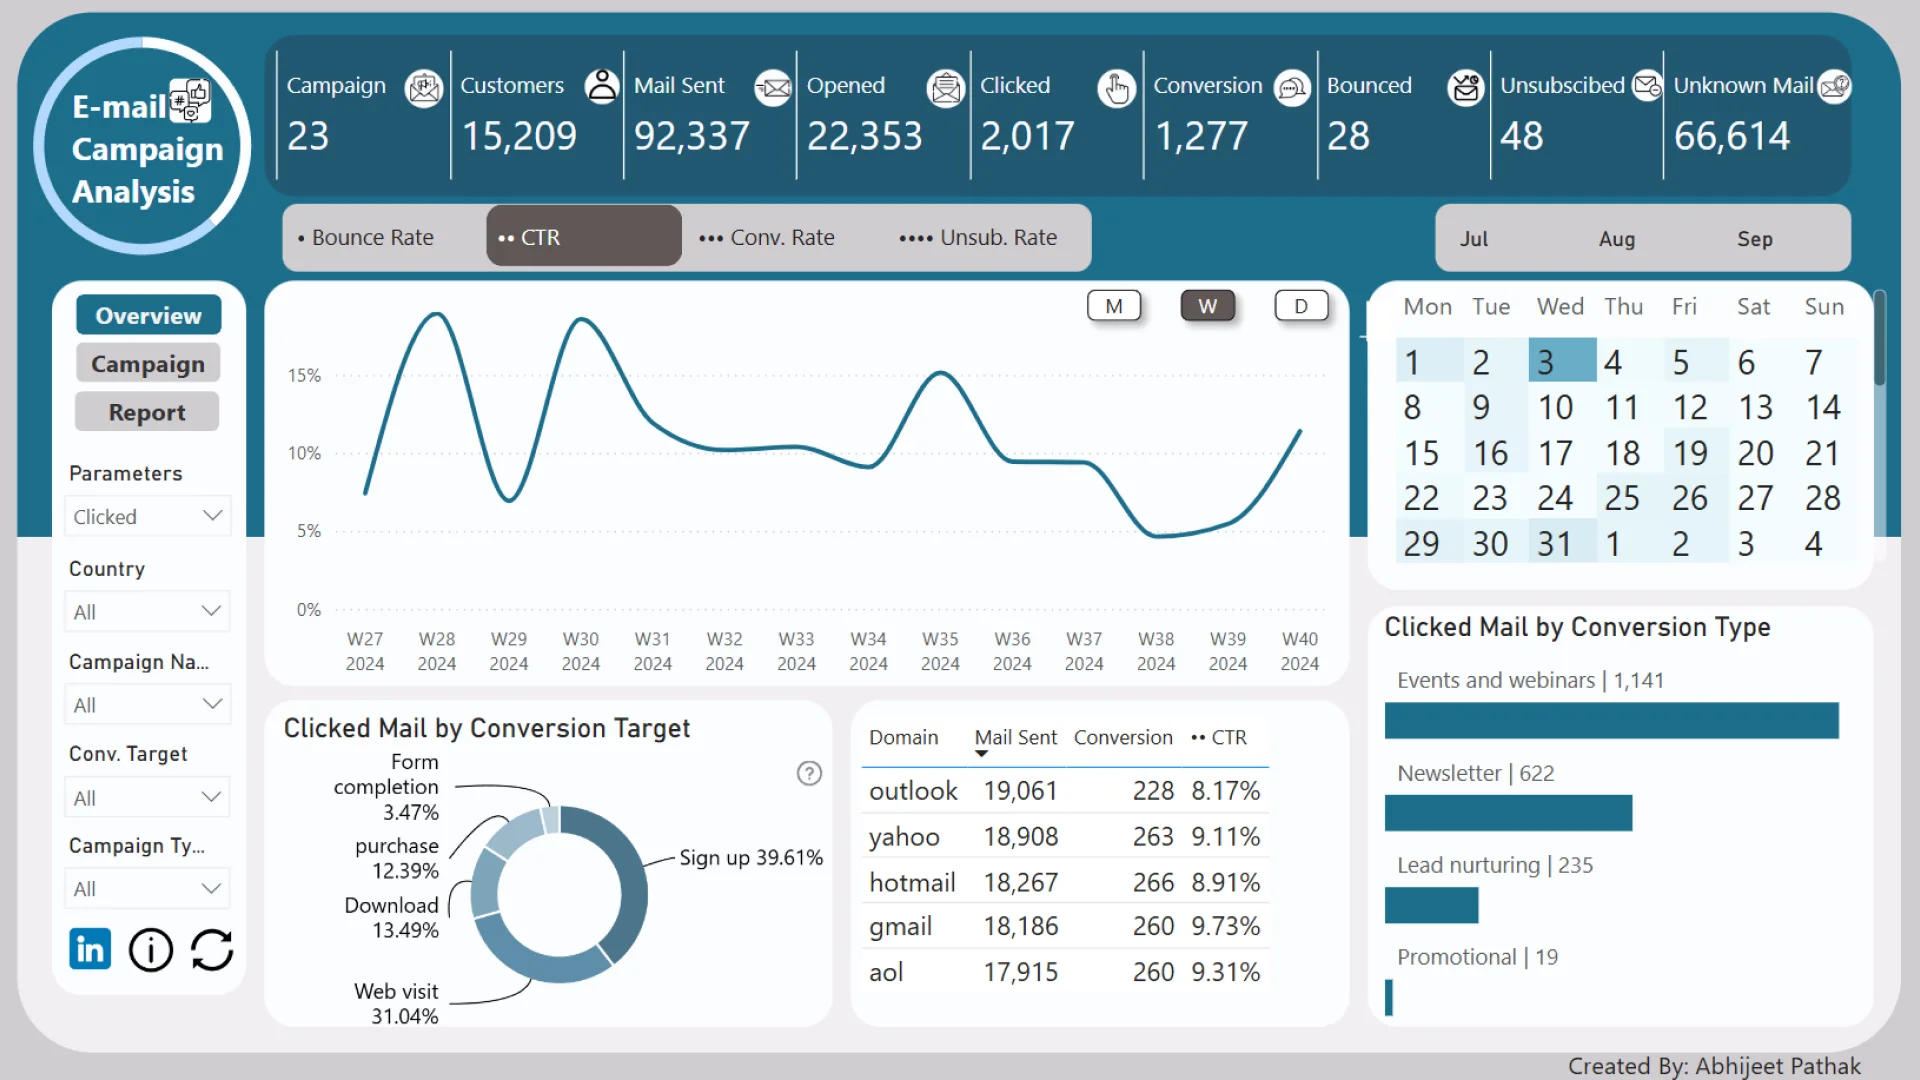
Report submitted for the FP20 Analytics ZoomCharts Challenge, October 2024. The report was built using the Marketing Email Campaign performance dataset and includes ZoomCharts custom Drill Down PRO visuals for Power BI.
Author's description:
The Power BI dashboard for email campaign analysis provides a comprehensive overview of key performance indicators, featuring a KPI summary that highlights crucial metrics at a glance. A calendar heat map visualizes engagement patterns over the month, while detailed trend analysis charts enable an in-depth examination across various time frames—monthly, weekly, and daily.
The dashboard categorizes conversion targets and offers insights into the distribution of conversion types, helping users identify effective strategies. Additionally, it includes domain analysis and parameter analysis of campaigns, showcasing emails sent globally and highlighting top-performing campaigns.
This self-service BI report empowers users to explore data interactively and derive actionable insights with ease.


4U Report Challenges
Participate in data challenges, build and submit reports to get free template downloads.
Join CommunityMobile view allows you to interact with the report. To Download the template please switch to desktop view.
How to use a PBIX template
Preview the interactive report, download the PBIX file, open it in Power BI Desktop, and replace the same data connection with your own dataset.
Preview and download
Explore the report online and download the PBIX template file.
Open in Power BI Desktop
Open the downloaded PBIX file in Power BI Desktop.
Connect your data
Replace the sample data source with your own dataset.
Refresh and adjust
Refresh the model and update fields or visual were needed.
Save and share
Save your report and publish it for your audience.


