277
Electronics Product Data Ratings 2
Share template with others
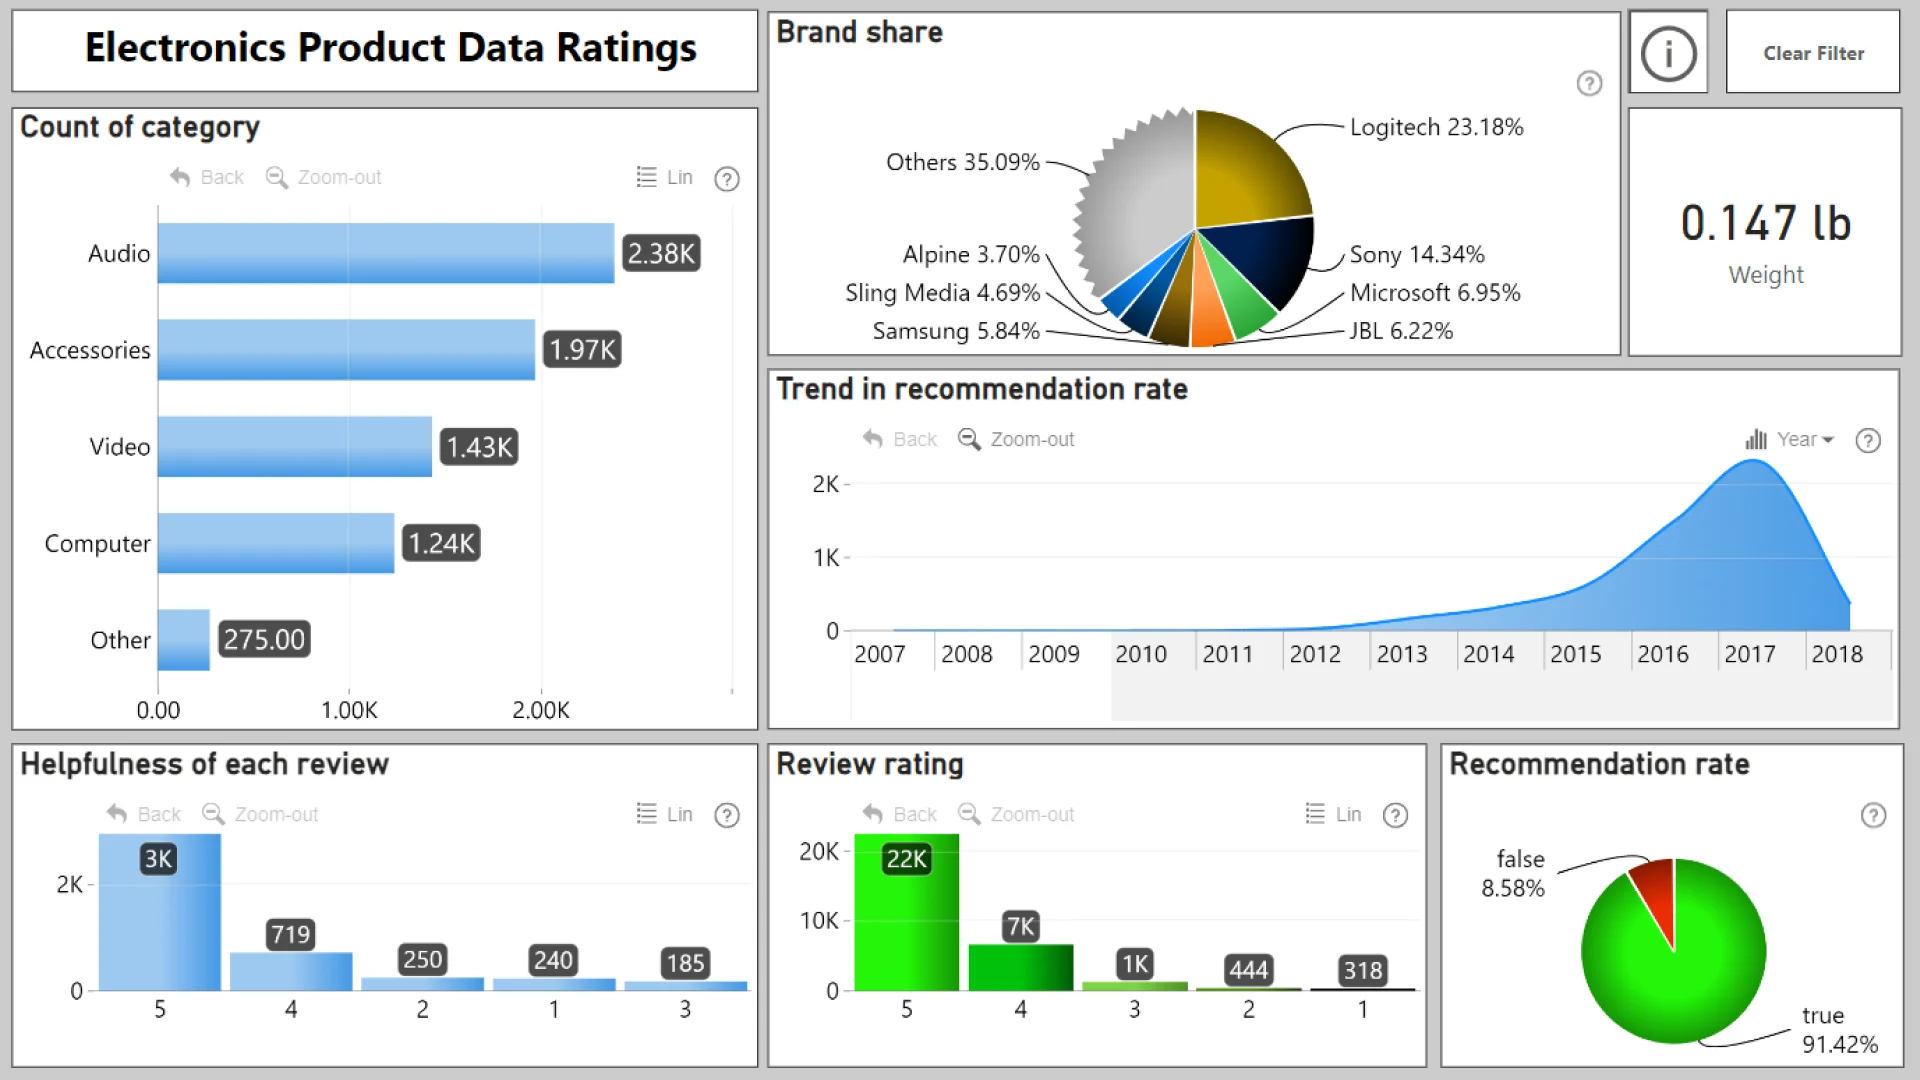
Report submitted for Onyx Data DataDNA ZoomCharts Mini Challenge, February 2024. The report was built based on Electronics Product Data Ratings dataset and includes ZoomCharts custom Drill Down PRO visuals for Power BI.
Author's description:
Electrics Product Data Analysis As can be seen in the dashboard most of the product have high demand and recommendation rate at the end of the year (could be due to Black Friday, Christmas,...). Especially, computer category have high demand in July, August due to back to school season. The highest demand belong to accessories products due to the use of it for many daily activities, this have high demand in Jan to Feb. The not recommendation rate is highest in Accessories and Other category. The brand account the most product is Logitech mostly Accessories and Computer related products.
ZoomCharts visuals used
Need help?
Send your question to ZoomCharts assistant, and we will respond to you as soon as possible.
Contact UsMobile view allows you to interact with the report. To Download the template please switch to desktop view.

ZoomCharts Academy
Learn ZoomCharts with experts and become certified!
Go to Academy!
Was this helpful? Thank you for your feedback!
Sorry about that.
How can we improve it?

