1820
Electronic Product Performance Power BI Dashboard
Electronic Product Performance Power BI Dashboard
More Report pages
Report Author: Shraddha Jain
1820
Share template with others
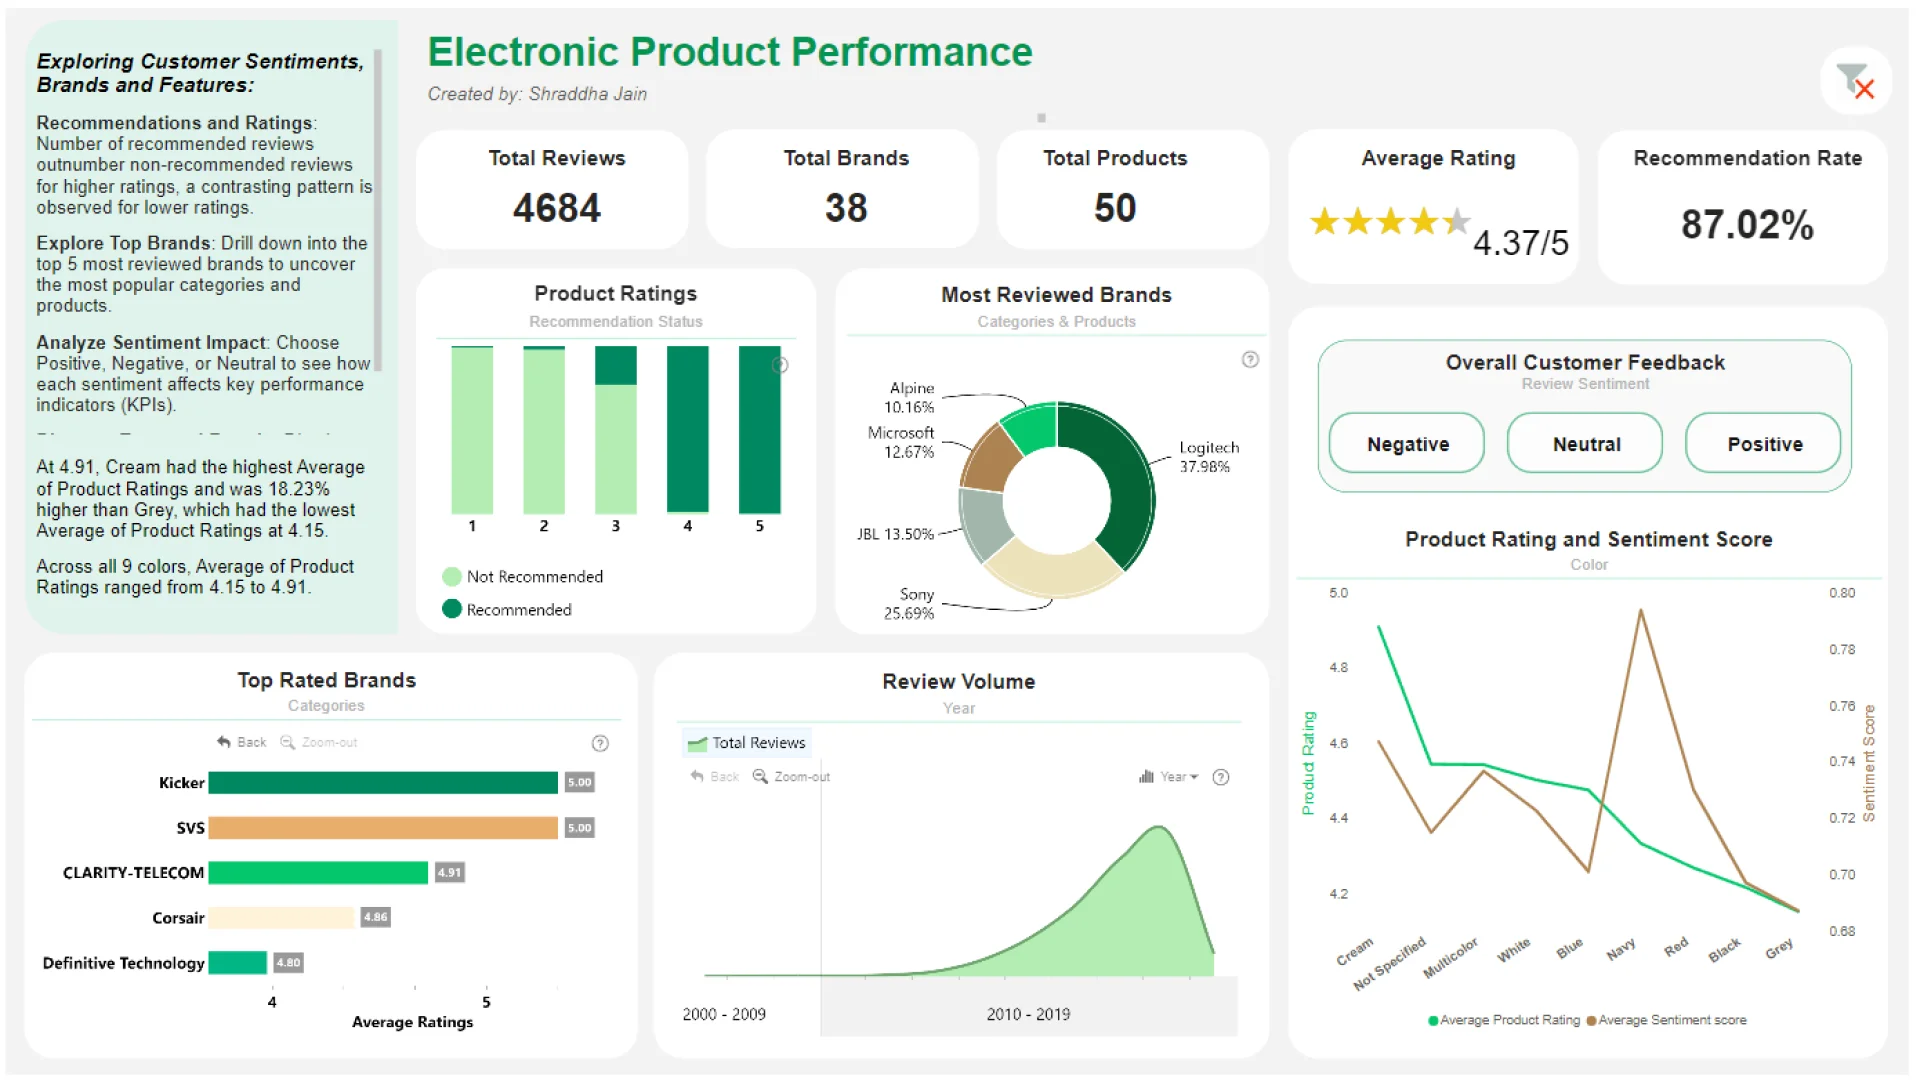
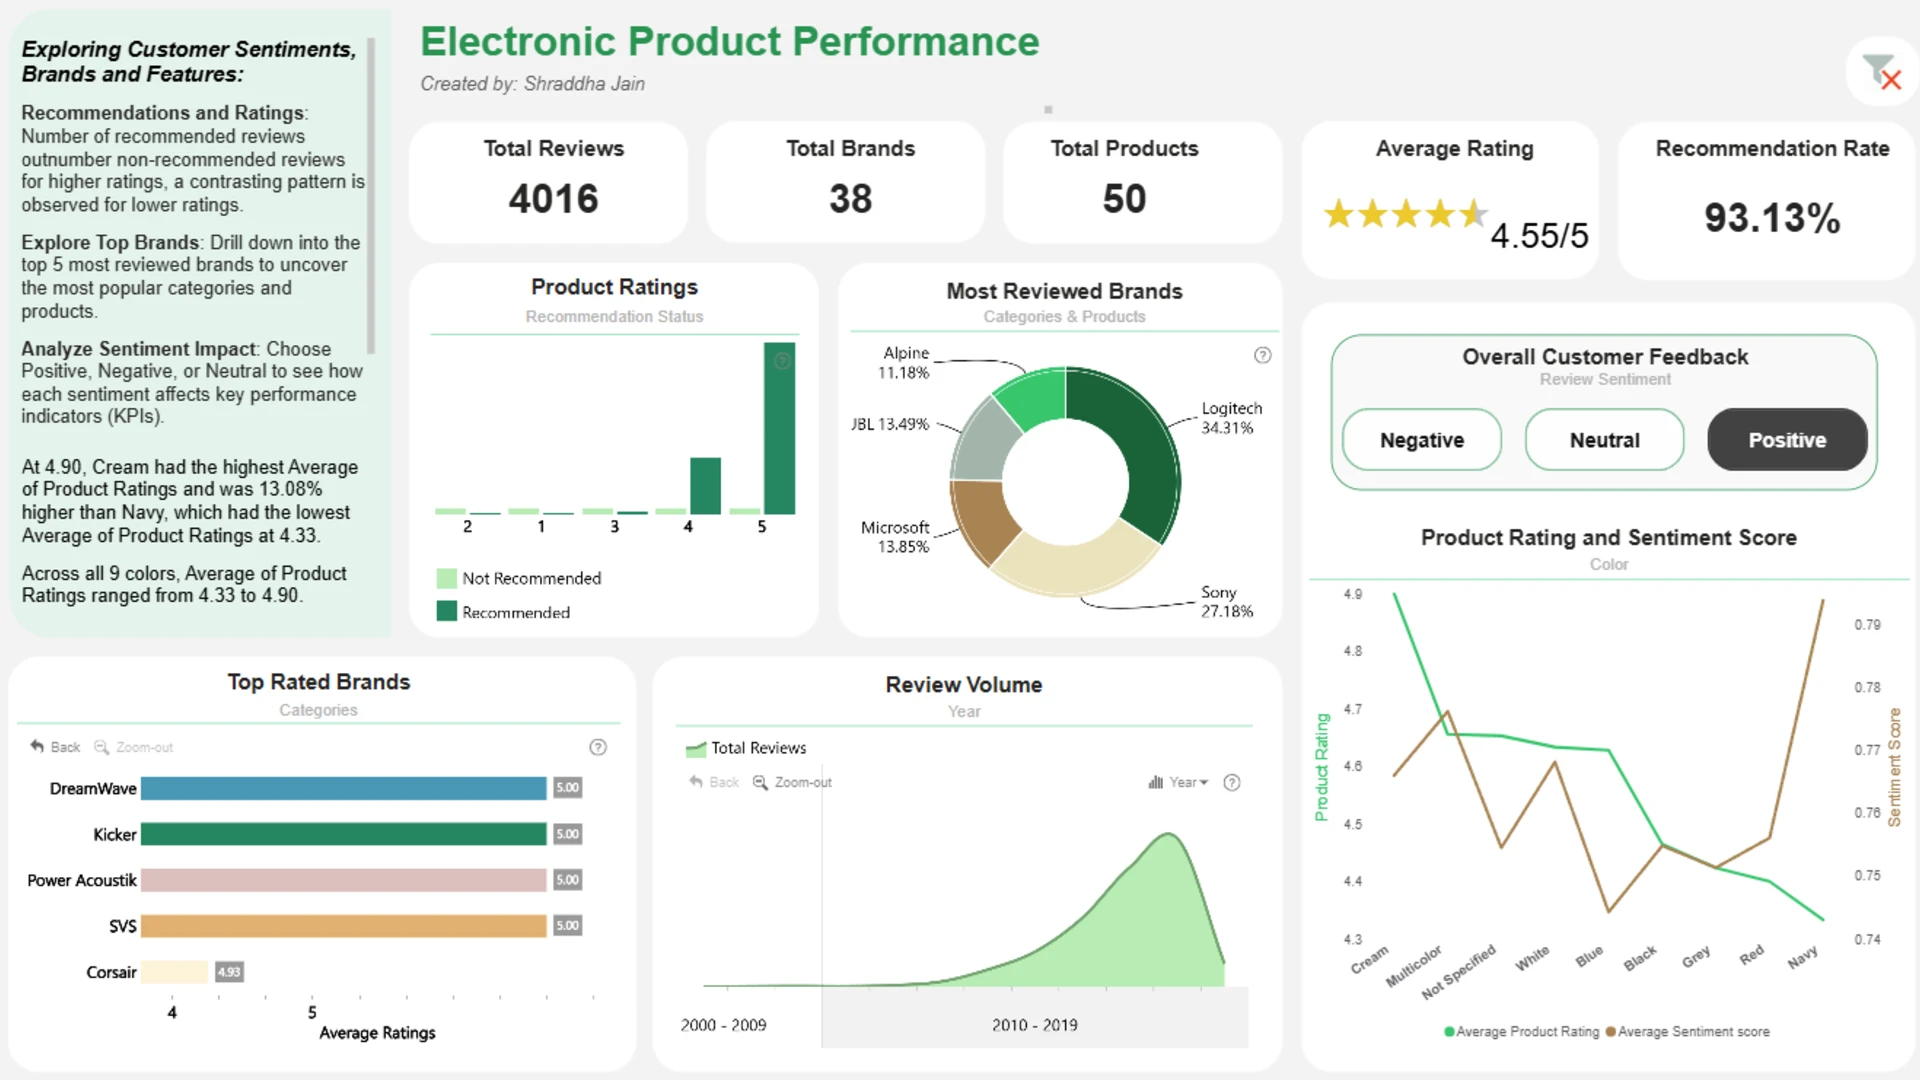
Explore a Power BI dashboard example for analyzing electronics product ratings, review recommendations, customer sentiment, brand performance, and review volume trends. This report helps ecommerce, retail, and product teams compare top-rated brands, identify the most-reviewed products, understand how sentiment affects ratings, and spot patterns in recommended versus non-recommended reviews.
- Analyzing Review Recommendations and Ratings: Recommended reviews outnumber non-recommended ones in higher ratings; contrasting patterns in lower ratings.
- Exploring Leading Brands: Drill down into the top 5 most reviewed brands to uncover popular categories and products.
- Assessing Sentimental Influence: Examine positive, negative, or neutral sentiments to understand their impact on key performance indicators (KPIs).
- Discovering Top-Rated Brands: Investigate highest-rated brands by drilling down to identify best-rated categories within each.
Open the report to explore its interactivity. Download the .pbix file to customize it with your own data.
ZoomCharts visuals used




4U Report Challenges
Participate in data challenges, build and submit reports to get free template downloads.
Join CommunityMobile view allows you to interact with the report. To Download the template please switch to desktop view.
How to use a PBIX template
Preview the interactive report, download the PBIX file, open it in Power BI Desktop, and replace the same data connection with your own dataset.
Preview and download
Explore the report online and download the PBIX template file.
Open in Power BI Desktop
Open the downloaded PBIX file in Power BI Desktop.
Connect your data
Replace the sample data source with your own dataset.
Refresh and adjust
Refresh the model and update fields or visual were needed.
Save and share
Save your report and publish it for your audience.


