594
E-COMMERCE KPI ANALYSIS - CHALLENGE 19
E-COMMERCE KPI ANALYSIS - CHALLENGE 19
Report Author: Marcos Contreras León
594
Share template with others
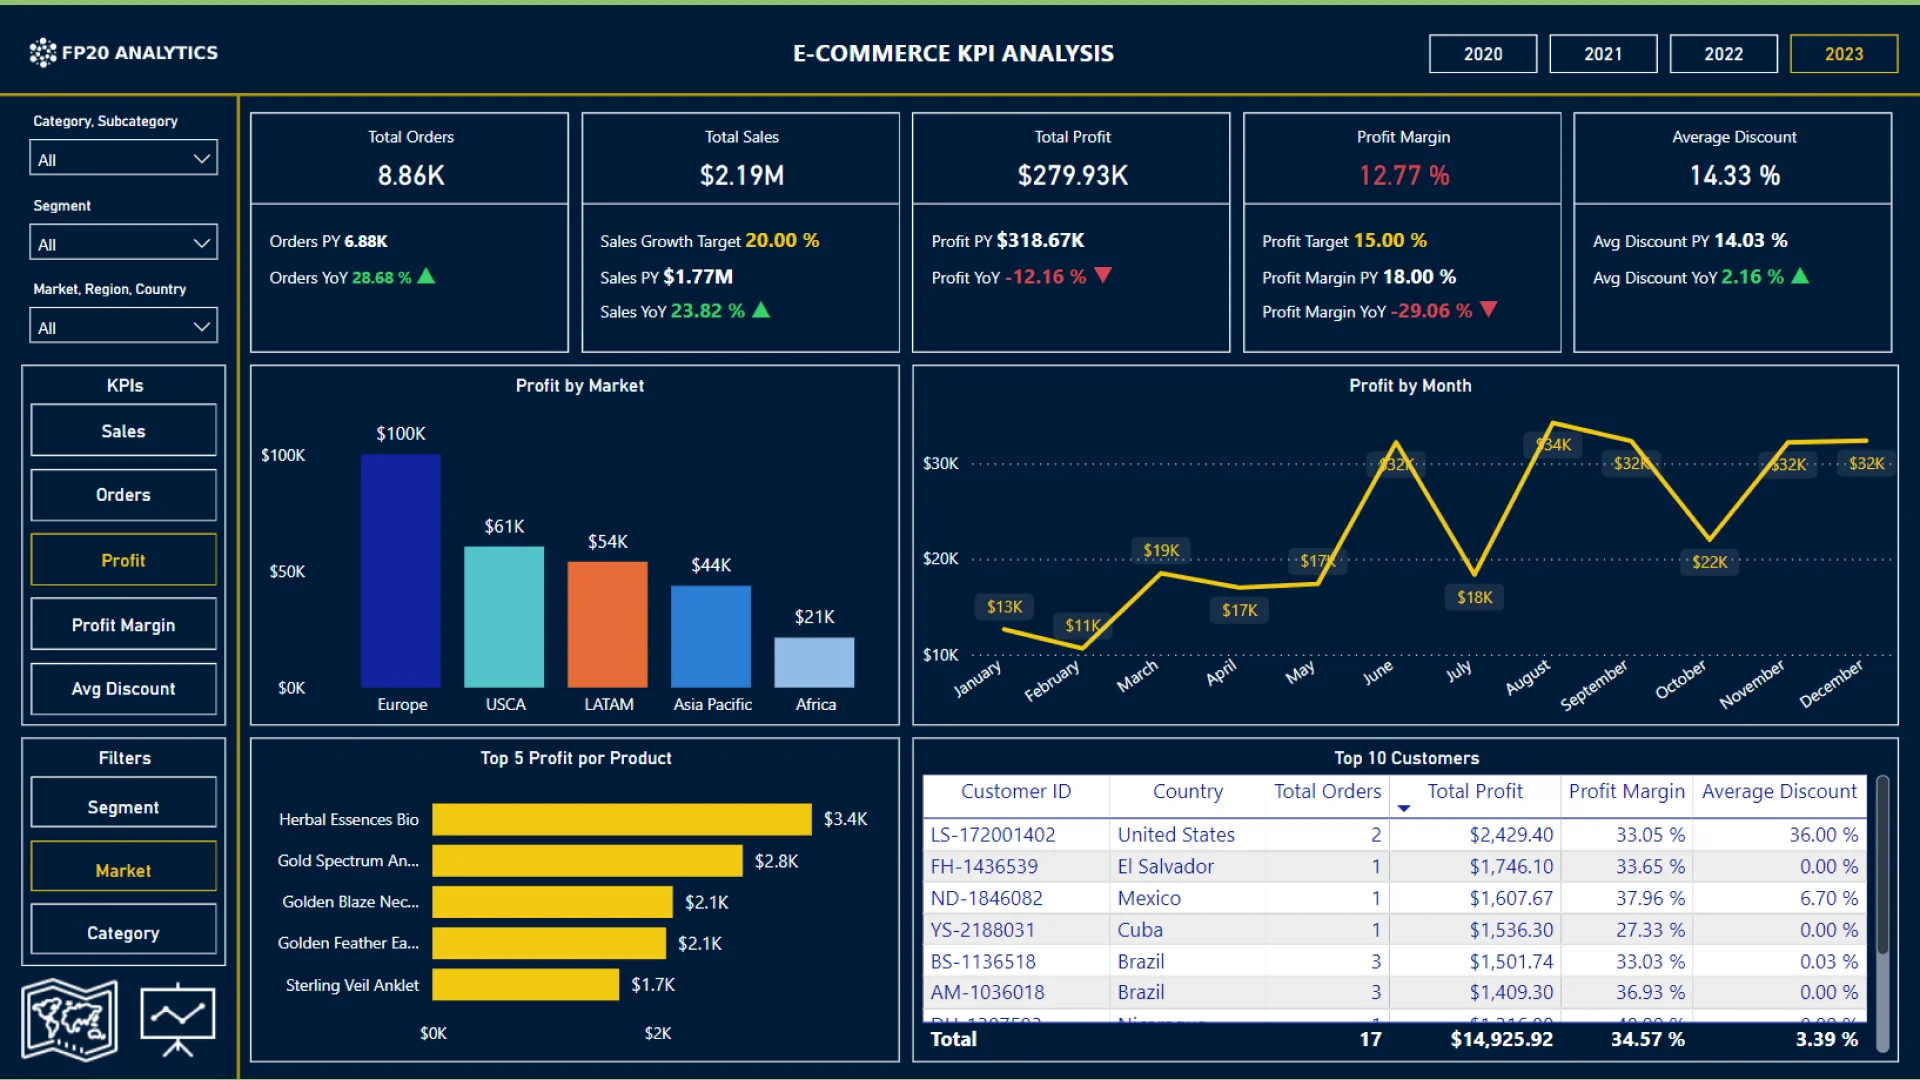
Report submitted for FP20 Analytics ZoomCharts Challenge 19 (September 2024). The report was built with the E-commerce KPI Analysis dataset and includes ZoomCharts custom Drill Down PRO visuals for Power BI.
Author's description:
As part of this challenge, I created a comprehensive Power BI report analyzing sales volumes and profitability for a global skincare and beauty e-store. The report focuses on key performance indicators (KPIs) critical to the success of the store and provides actionable insights to drive strategic decision-making for future growth.
4U Report Challenges
Participate in data challenges, build and submit reports to get free template downloads.
Join CommunityMobile view allows you to interact with the report. To Download the template please switch to desktop view.

Was this helpful? Thank you for your feedback!
Sorry about that.
How can we improve it?