500
E-commerce 2
E-commerce 2
Report Author: Abhishek Kalra
500
Share template with others
Report submitted for FP20 Analytics ZoomCharts Challenge 19 (September 2024). The report was built with the E-commerce KPI Analysis dataset and includes ZoomCharts custom Drill Down PRO visuals for Power BI.
Author's description:
Skincare Sales Symphony: A Snapshot
🎻 From January 2020 to December 2023, the skincare market experienced phenomenal growth:
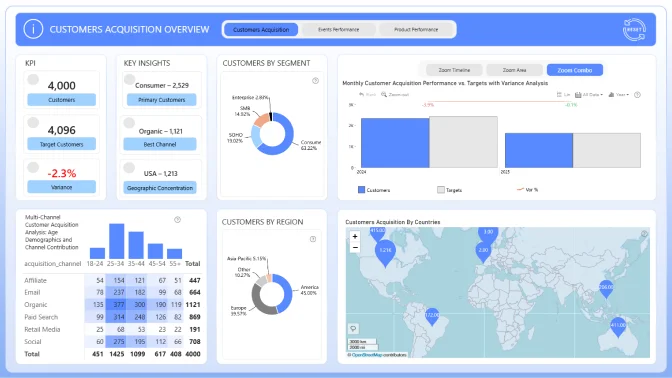
📈 Orders surged by 409.26%, with a notable 21.95% increase starting in June 2023. The steepest climb was from 902 to 1100 orders between June and December 2023. 🚀
📈 Customers increased by 400.47%, with a 21.03% rise starting in June 2023. The steepest climb saw customers jump from 889 to 1076.
🌟 Body care led with 14,855 orders and 11,648 customers, far outpacing Face care.
💪 The Consumer segment dominated with 9k orders (51.60%) and the most customers.
🥧 Nail care products stood out with 5.43k orders (26.1%) and 4.86k customers (25.4%).
💬 North America and Europe had the highest concentrations of orders and customers, with growing interest in Asia and South America.
🌍 Skincare Sales Symphony: A Harmonious Growth Story
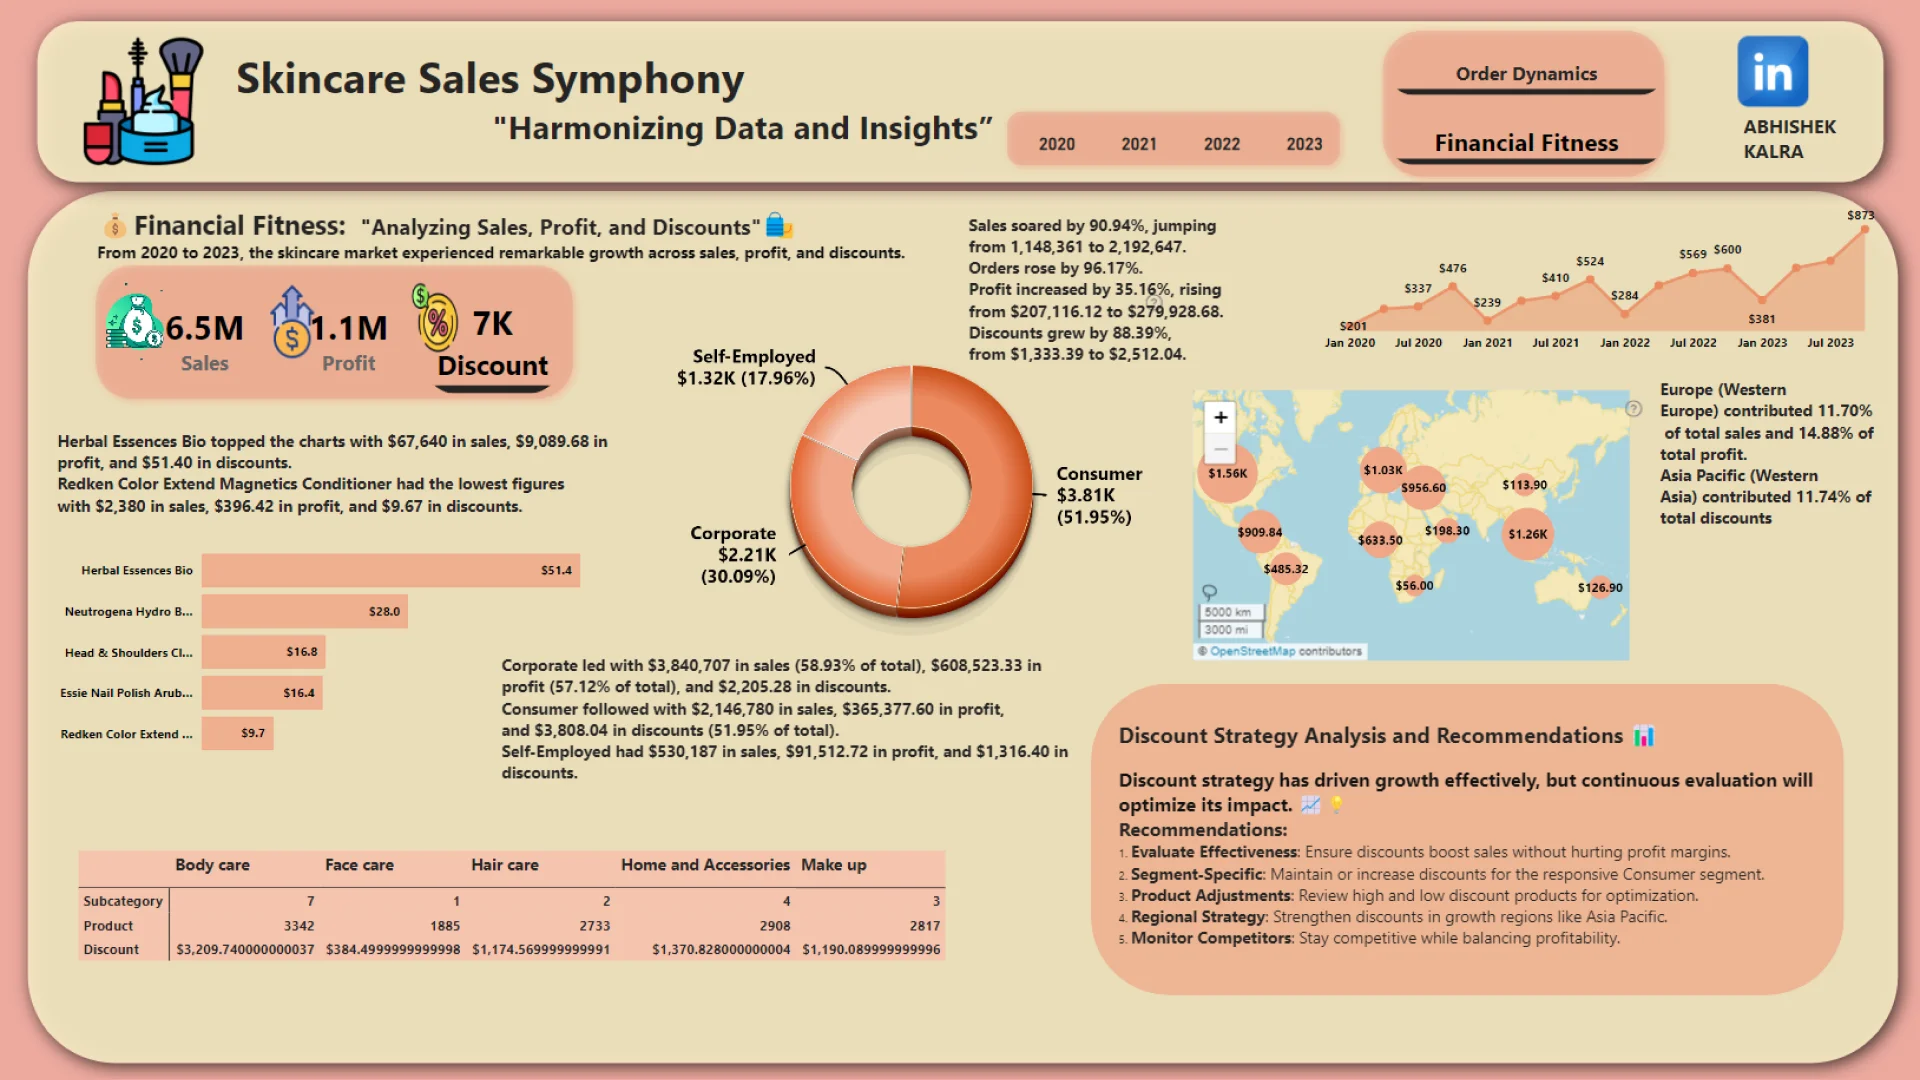
🎻 From 2020 to 2023, the skincare market experienced remarkable growth across sales, profit, and discounts.
Sales and Orders Surge 📈 Sales soared by 90.94%, jumping from 1,148,361 to 2,192,647. Orders rose by 96.17%. Profit increased by 35.16%, rising from $207,116.12 to $279,928.68. Discounts grew by 88.39%, from $1,333.39 to $2,512.04.
Top Segments 🥇 Corporate led with $3,840,707 in sales (58.93% of total), $608,523.33 in profit (57.12% of total), and $2,205.28 in discounts. Consumer followed with $2,146,780 in sales, $365,377.60 in profit, and $3,808.04 in discounts (51.95% of total). Self-Employed had $530,187 in sales, $91,512.72 in profit, and $1,316.40 in discounts.
Product Performance 💪 Herbal Essences Bio topped the charts with $67,640 in sales, $9,089.68 in profit, and $51.40 in discounts. Redken Color Extend Magnetics Conditioner had the lowest figures with $2,380 in sales, $396.42 in profit, and $9.67 in discounts.
Regional Distribution 🌍 Europe (Western Europe) contributed 11.70% of total sales and 14.88% of total profit. Asia Pacific (Western Asia) contributed 11.74% of total discounts.Visual Insights: Pie Chart (Sales by Segment) 🥧: Corporate segment dominates sales and profit, while the Consumer segment leads in discounts.
Bubble Chart (Top Product Performance) 💬: Highlights top and bottom performers in both profit and discounts.
Map Visual (Geographical Spread) 🌐: North America and Europe show the highest concentration of sales and profit, with notable growth in Asia and South America for sales and profit, and significant discounts in Asia Pacific.
Discount Strategy Analysis:
Effectiveness: Discounts increased significantly, indicating an aggressive strategy.
Segment Focus: Consumer segment showed strong responsiveness to discounts. Product Variation: Wide range of discounts across products. Regional Strategy: Focused discounts in Asia Pacific.
Recommendations: Evaluate Effectiveness: Ensure discounts boost sales without hurting profit margins.
Segment-Specific: Maintain or increase discounts for the responsive Consumer segment.
Product Adjustments: Review high and low discount products for optimization. Regional Strategy: Strengthen discounts in growth regions like Asia Pacific. Monitor Competitors: Stay competitive while balancing profitability. This symphony of data showcases the dynamic growth and market leadership in the skincare industry. 🎶📈💡
4U Report Challenges
Participate in data challenges, build and submit reports to get free template downloads.
Join CommunityMobile view allows you to interact with the report. To Download the template please switch to desktop view.

Was this helpful? Thank you for your feedback!
Sorry about that.
How can we improve it?