153
Customer Satisfaction & Loyalty Analysis
Share template with others
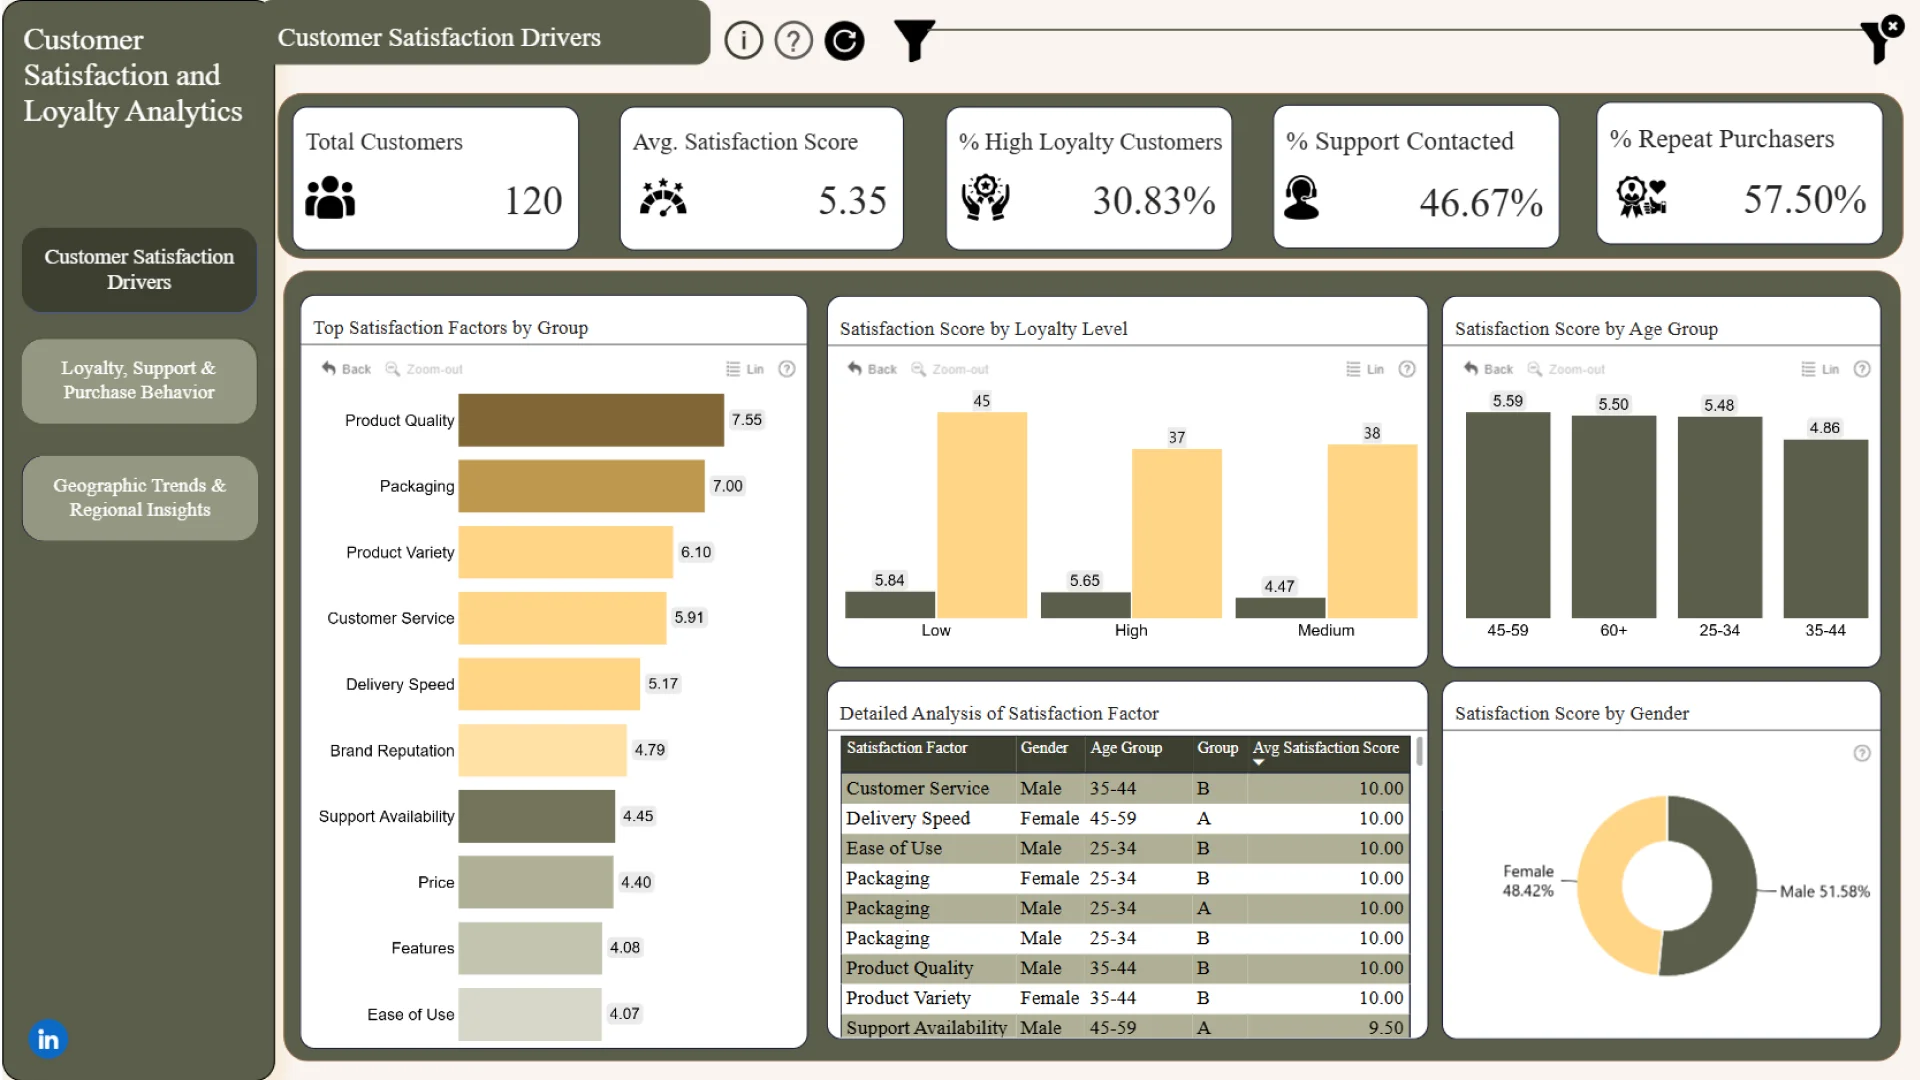
As a data analyst, I stepped into the role at OmniRetail, a U.S. electronics and smart home retailer, to analyze 2024 customer satisfaction and loyalty data. Using Power BI, I explored how support experiences, demographics, and purchase behavior impact customer loyalty. This challenge was a fantastic chance to combine data exploration, strategic storytelling, and impactful visual design. It deepened my ability to turn raw data into actionable insights. This was a fantastic opportunity to blend analytics, interactivity, and design into one cohesive story! 💡📈
ZoomCharts visuals used
Need help?
Send your question to ZoomCharts assistant, and we will respond to you as soon as possible.
Contact UsMobile view allows you to interact with the report. To Download the template please switch to desktop view.

ZoomCharts Academy
Learn ZoomCharts with experts and become certified!
Go to Academy!
Was this helpful? Thank you for your feedback!
Sorry about that.
How can we improve it?

