logo
For Power BI Report Templates
  • Products

    Drill Down Visuals for Power BI

    Discover the most customizable custom visuals for Power BI.

    Pricing & licensing
    • Drill Down Donut Pro
      Drill Down Donut Category Composition
    • Drill Down Pie Pro
      Drill Down Pie Proportional Breakdown
    • Drill Down Combo Pro
      Drill Down Combo Multi-Metric Trends
    • Drill Down Combo Bar Pro
      Drill Down Combo Bar Cross-Metric Trends
    • Drill Down Line Pro
      Drill Down Line Trend Analysis
    • Drill Down Bubble Pro
      Drill Down Bubble Value Relationships
    • Drill Down Scatter Pro
      Drill Down Scatter Correlation Analysis
    • Drill Down Network Pro
      Drill Down Network Entity Connections
    • Drill Down Graph Pro
      Drill Down Graph Relationship Mapping
    • Drill Down Map Pro
      Drill Down Map Geographic Insights
    • Drill Down Waterfall Pro
      Drill Down Waterfall Change Breakdown
    • Drill Down Timeline Pro
      Drill Down Timeline Time-Based Metrics
    • Drill Down TimeSeries Pro
      Drill Down TimeSeries Temporal Patterns
    • Drill Down Line Pro
      Drill Down Line Trend Analysis

    Visuals in Planning

    Discover visuals we’re exploring, share your feedback, and help us decide what to build next.

    Browse concepts
  • Template Reports
    • Browse Report Templates
      Browse Report Templates Explore 2000+
      Power BI reports
    • Pricing Report Templates
      unlimited access

    Explore Report Templates

    Industry

    • Logistics
    • Education
    • Healthcare
    • Transportation
    • Banking
    • Ecommerce
    • Crime analytics
    • Retail
    • Manufacturing

    Business Domain

    • Sales
    • Marketing
    • Accounting & Finance
    • Human Resources
    • Research
    • Project Management
    • CRM
    • Support
    • Customer experience
  • Resources

      Learn

    • Video Tutorials Step-by-step Power BI guides
    • Webinars Live and recorded expert sessions
    • Visuals Gallery Explore all custom Power BI visuals
    • Blog Power BI tips, updates, and guides
    • Documentation Setup, features, and API reference

    Support

    • ZoomCharts Assistance Help from our product experts
    • Contact Sales Questions about pricing or licensing
    • Contact Support Technical help and troubleshooting
    • FAQ Quick answers to common questions
  • Services
    • Power BI Report Development
      Power BI Report Development End-to-end custom
      Power BI reports.
    • Custom Visual Development
      Custom Visual Development Custom visuals for
      your business needs.
  • Challenges
  • Pricing
Get started
Get started
Get it now
Go back

Contents

Dashboard and report examples CRM Sales Pipeline Analysis 4
Go back

845

CRM Sales Pipeline Analysis 4

CRM Sales Pipeline Analysis 4

Report
Report

More Report pages

Report
Report
Report
Report
Report Interact

Report Author: Magdalena Koszczuk

845

Combo Combo Bar Timeline

Share template with others

Report submitted for FP20 Analytics ZoomCharts Challenge 17 (July 2024). The report was built with the CRM & Sales Pipeline Analysis dataset and includes ZoomCharts custom Drill Down PRO visuals for Power BI. 

Author's description:
📈 This month I am participating in FP20 Analytics Challenge 17 by Federico Pastor and ZoomCharts.
📈 The dataset pertains to a company seeking to assess its CRM data and sales pipeline for leads registered over the past five months. The objective is to create an in-depth analytical report that delivers insights into lead distribution by country, industry, and organization size. The report will also evaluate the health of the sales pipeline, project potential income for the upcoming months, and compare the performance of sales agents.
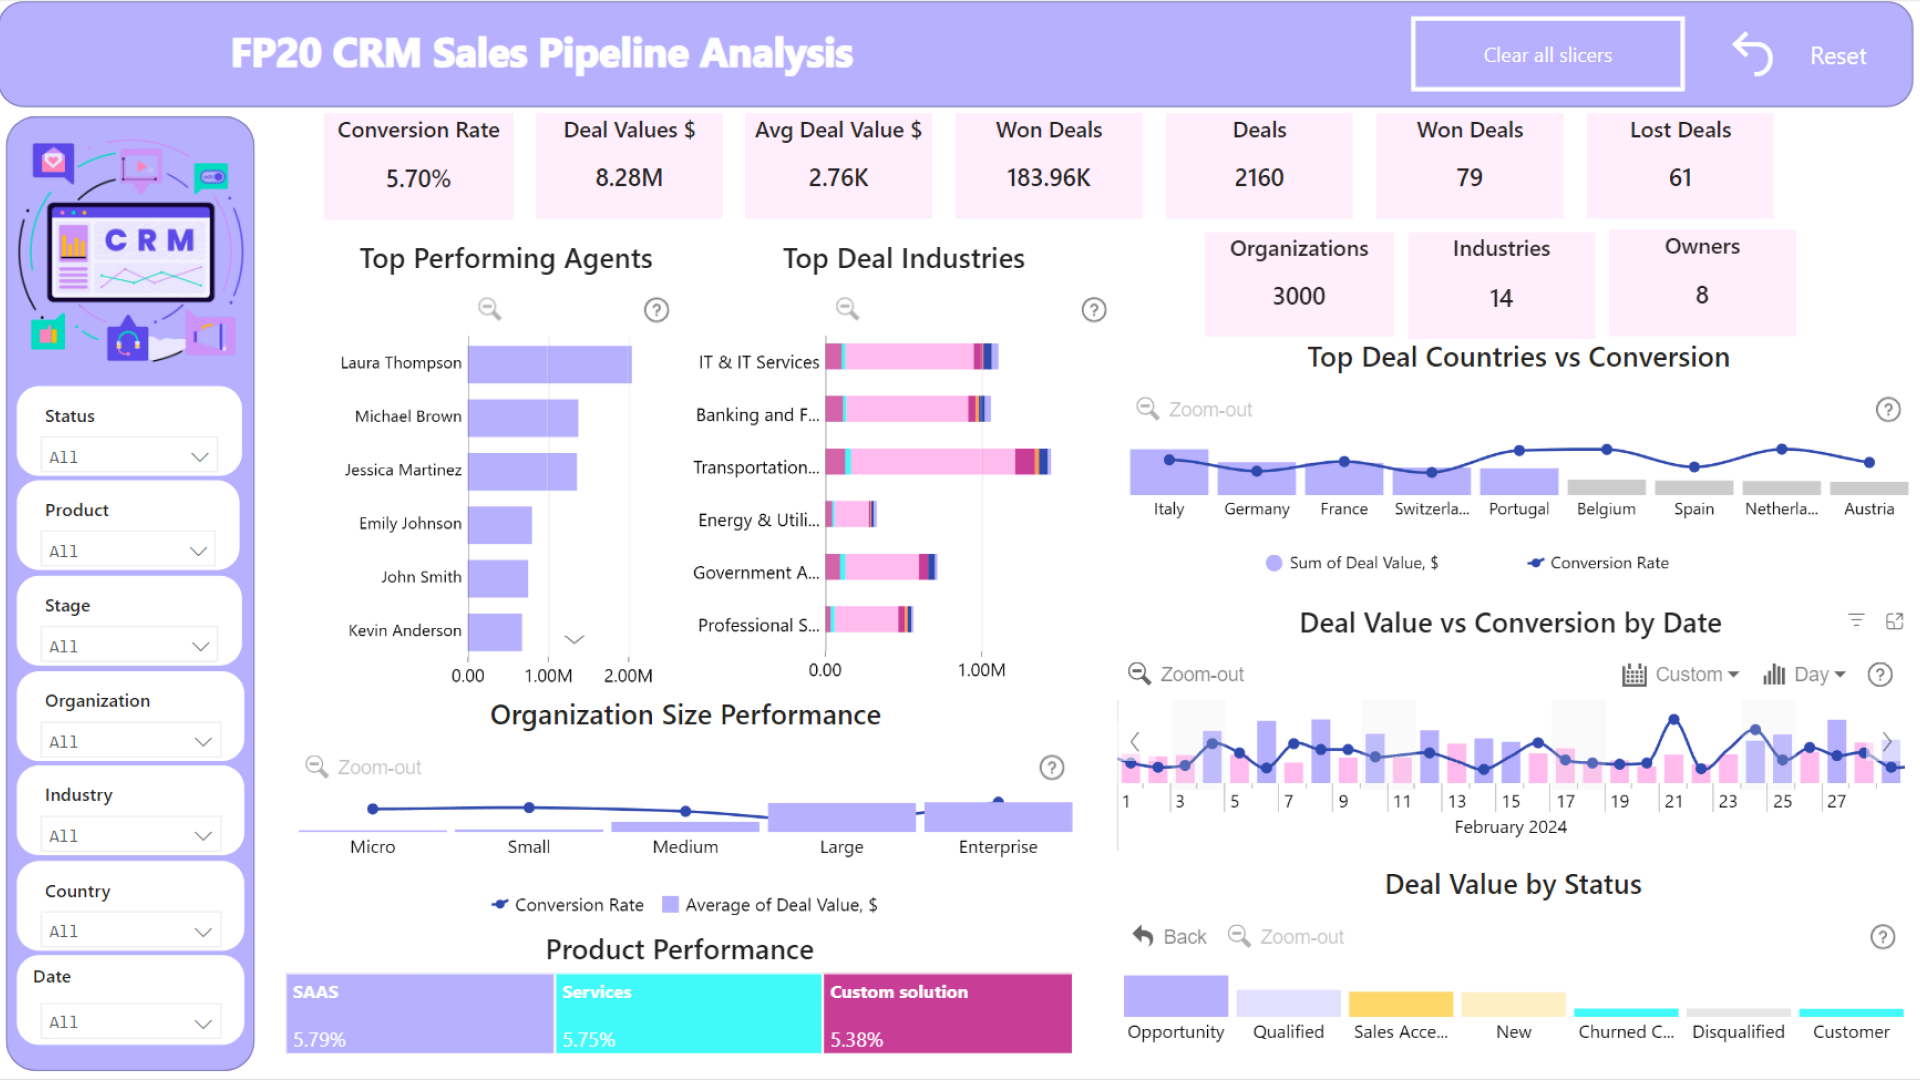
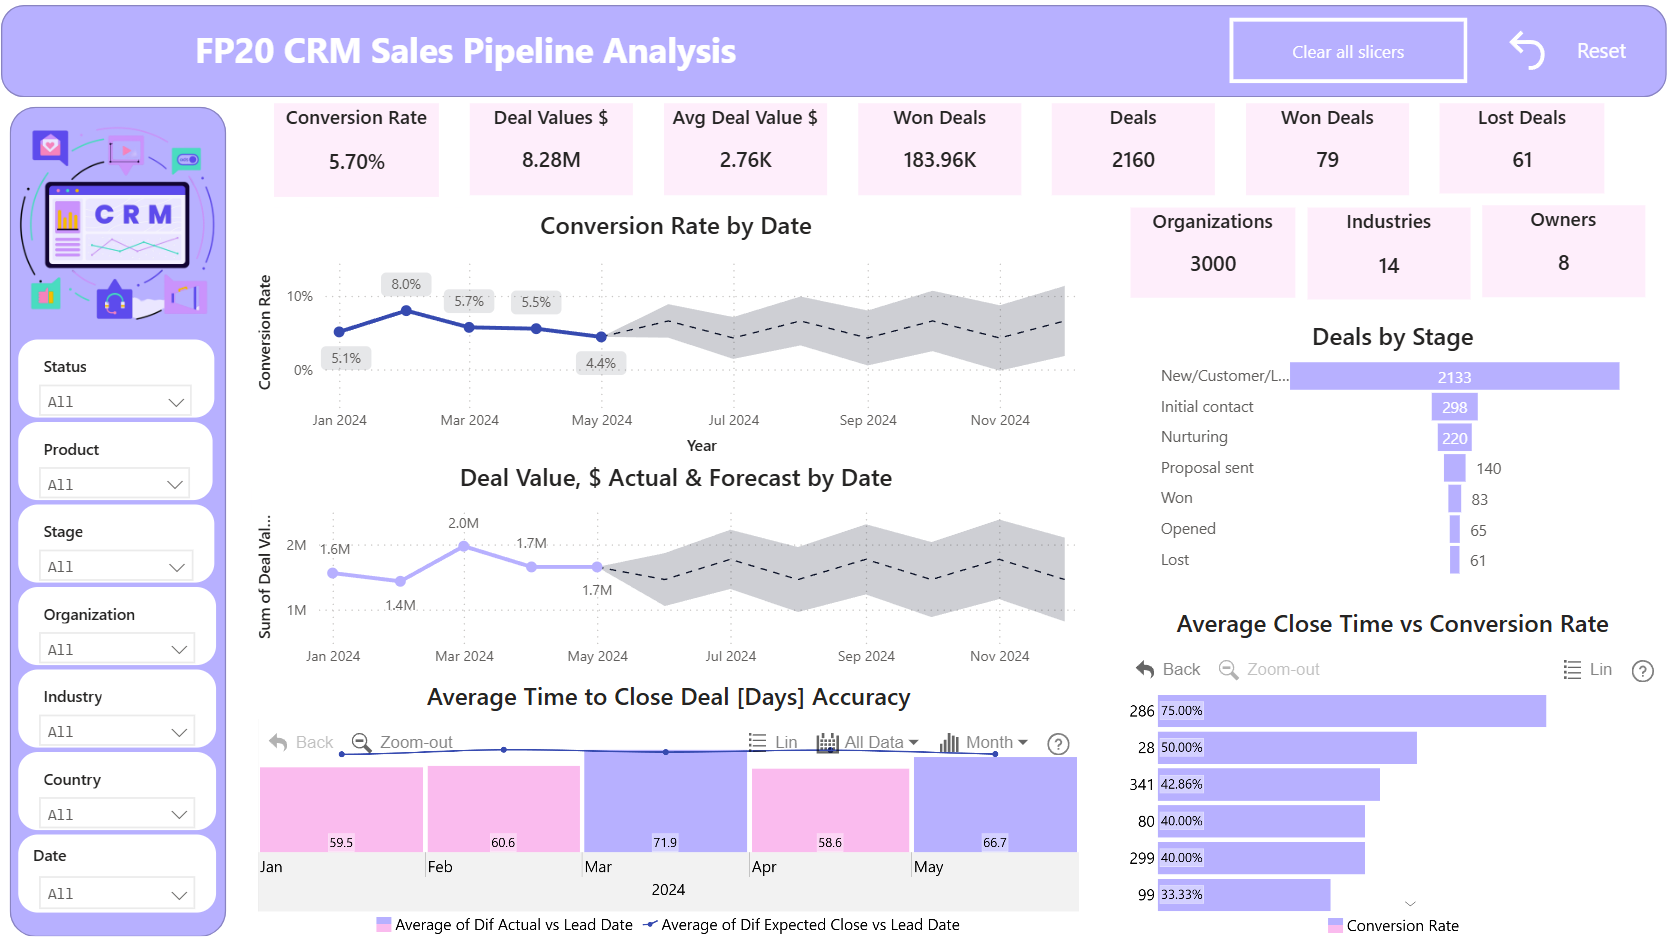
📊 Link to interactive dashboard in Power BI: To be Added Soon Analyzed areas and insights: The pipeline shows healthy conversion rate of 5.7% with $184,000 in sales from 79 won deals. The average expected time of 196 days leaves place for optimization in the time to reduce cycle times.
📈 Trends in Deal Values & Forecast: Analyzed variations in average deal values to understand seasonal trends and market influences. ->February had the highest conversion rate for deals. Both deal values and conversion rate are decreasing since February, which requires attention and new strategy in order to not fulfill declining deal value forecast. ->Italy have the biggest potential for deals with significantly higher number of organizations, agents achieve the best conversion rate in Netherlands, while Germany highest average deal value.
📈 Sales Performance by Industry: Investigated which industries generate the highest deal values and the most closed deals. Transportation and Logistics is the industry with biggest deal value gained from customers. While IT & Services has the biggest value of Won deals.
📈 Top Sales Agents Performance: Recognized the agents who consistently secure high-value deals and manage a substantial volume of transactions. 📈 Importance of Organization Size: Examined how the size of an organization affects the sales cycle duration and deal value. Enterprises and small organizations have the biggest conversion rate. Enterprises focus on Custom solution and Services, while small chose variety of products.
📈 Duration of Sales Cycles: Analyzed the factors that influence the time taken from lead acquisition to deal closure - actual vs expected one. There is still a place for improvement to reduce cycle time although monthly average actual time is positive.
📈 Effectiveness of Product Strategies: SAAS has the best conversion rate and profitability out of products, characterizes lower average deal value than other product, which indicates that customers are more eager to acquire this option.

ZoomCharts visuals used

Drill Down Combo PRO Drill Down Combo PRO
Drill Down Combo Bar PRO Drill Down Combo Bar PRO
Drill Down Timeline PRO Drill Down Timeline PRO

4U Report Challenges

Participate in data challenges, build and submit reports to get free template downloads.

Join Community

Mobile view allows you to interact with the report. To Download the template please switch to desktop view.

Similar reports

All Reports 22 results
New
Report Card

E-Commerce Power BI Report 3

591

New
Report Card

E-Commerce Power BI Report

658

New
Report Card

E-Commerce Sales Analytics 20

433

Explore all reports

Was this helpful? Thank you for your feedback!

Sorry about that.

How can we improve it?

CRM Sales Pipeline Analysis 4

Report Author: Magdalena Koszczuk

845

ZoomCharts

Welcome to ZoomCharts

You’re almost there! Create an account to download reports.

or
Sign up with Microsoft

Verify your email address

We have sent a code to your email address. Please input the code below.

Didn't receive code? Request again (after 30 seconds)

Already have an account? Log in

ZoomCharts

Log in to your ZoomCharts account

Log in with Microsoft
or
Forgot password?

Reset your password

We'll email you instructions on how to reset your password

Don't have an account? Sign up

Please add credits

You have 0 available downloads.
Get more credits or upgrade your plan to continue.

View pricing
logo
[email protected]
+44 204 577 3993
logo

Products

Drill Down Bubble PRO Drill Down Line PRO Drill Down Network PRO Drill Down Waterfall PRO Drill Down Graph PRO Drill Down Combo PRO Drill Down Combo Bar PRO Drill Down Donut PRO Drill Down Pie PRO Drill Down TimeSeries PRO Drill Down Timeline PRO Drill Down Map PRO Drill Down Scatter PRO All Visuals

Resources

Report Examples Webinars Blog ZoomCharts Academy Visuals Gallery Documentation Custom Visual Development Subscribe to News

Solutions

Custom Visual Development

Company

Pricing About Us Partners Leave feedback Join PowerGroup EU Funding

Help

ZoomCharts Assistance Contact Sales Contact Support FAQ AI Information

Drill Down Line PRO Drill Down Bubble PRO Drill Down Network PRO Drill Down Waterfall PRO Drill Down Graph PRO Drill Down Combo PRO Drill Down Combo Bar PRO Drill Down Donut PRO Drill Down Pie PRO Drill Down TimeSeries PRO Drill Down Timeline PRO Drill Down Map PRO Drill Down Scatter PRO All Visuals

Report Examples Webinars Blog ZoomCharts Academy Visuals Gallery Documentation Custom Visual Development Subscribe to News

Custom Visual Development

Pricing About Us Partners Leave feedback Join PowerGroup EU Funding

ZoomCharts Assistance Contact Sales Contact Support FAQ AI Information
+44 204 577 3993
[email protected]

Ready to get in touch?

Contact our experts with any question about Power BI and ZoomCharts for Free!

Contact us

© 2026, Data Visualization Software Lab

U.S. Patents No. 11,645,343; 11,921,804; 12,346,389

Cookies
Privacy Policy
Global
Legal
Patent
warning

Error message

success

Success info: Done!

ZoomCharts AI Assistant

We noticed you're using an old OS version.

For the best experience, we recommend upgrading to ensure that all website features display correctly.

Cookie settings

We use necessary cookies for site functionality, as well as statistic, marketing, and preference cookies to enhance your experience. For more information and to manage your preferences, please visit our Cookie policy