680
CRM Sales Dahboard
CRM Sales Dahboard
Report Author: Rifa Kabeer
680
Share template with others
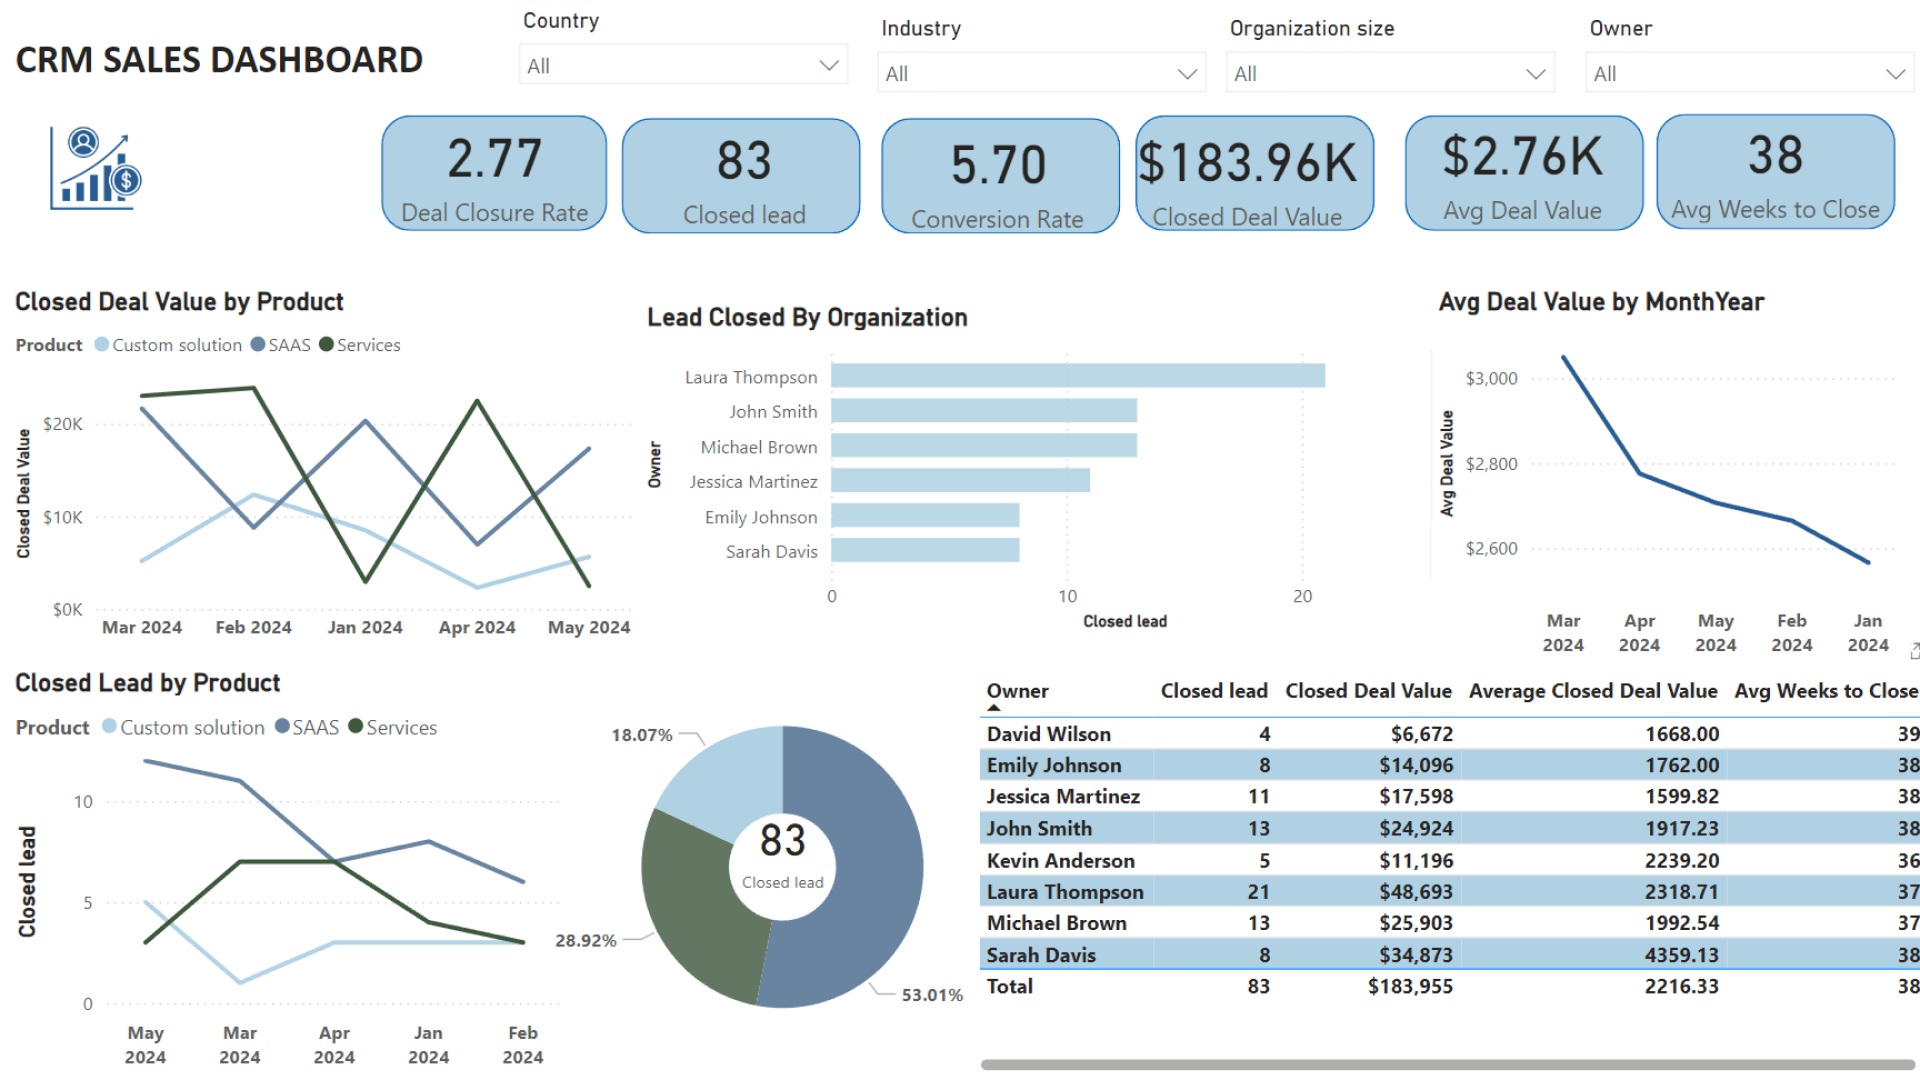
Report submitted for FP20 Analytics ZoomCharts Challenge 17 (July 2024). The report was built with the CRM & Sales Pipeline Analysis dataset and includes ZoomCharts custom Drill Down PRO visuals for Power BI.
Author's description:
The dataset is about a company who aims to evaluate its CRM data and sales pipeline for leads registered over the last five months. The task is to build a comprehensive analytical report that provides insights into lead distribution across countries, industries, and organization sizes. The report also assessed the health of the sales pipeline, forecast potential income over the next few months, as well as compared sales agent performance.
ZoomCharts visuals used
4U Report Challenges
Participate in data challenges, build and submit reports to get free template downloads.
Join CommunityMobile view allows you to interact with the report. To Download the template please switch to desktop view.

Was this helpful? Thank you for your feedback!
Sorry about that.
How can we improve it?