150
CRM and Sales Pipeline Analysis 5
Share template with others
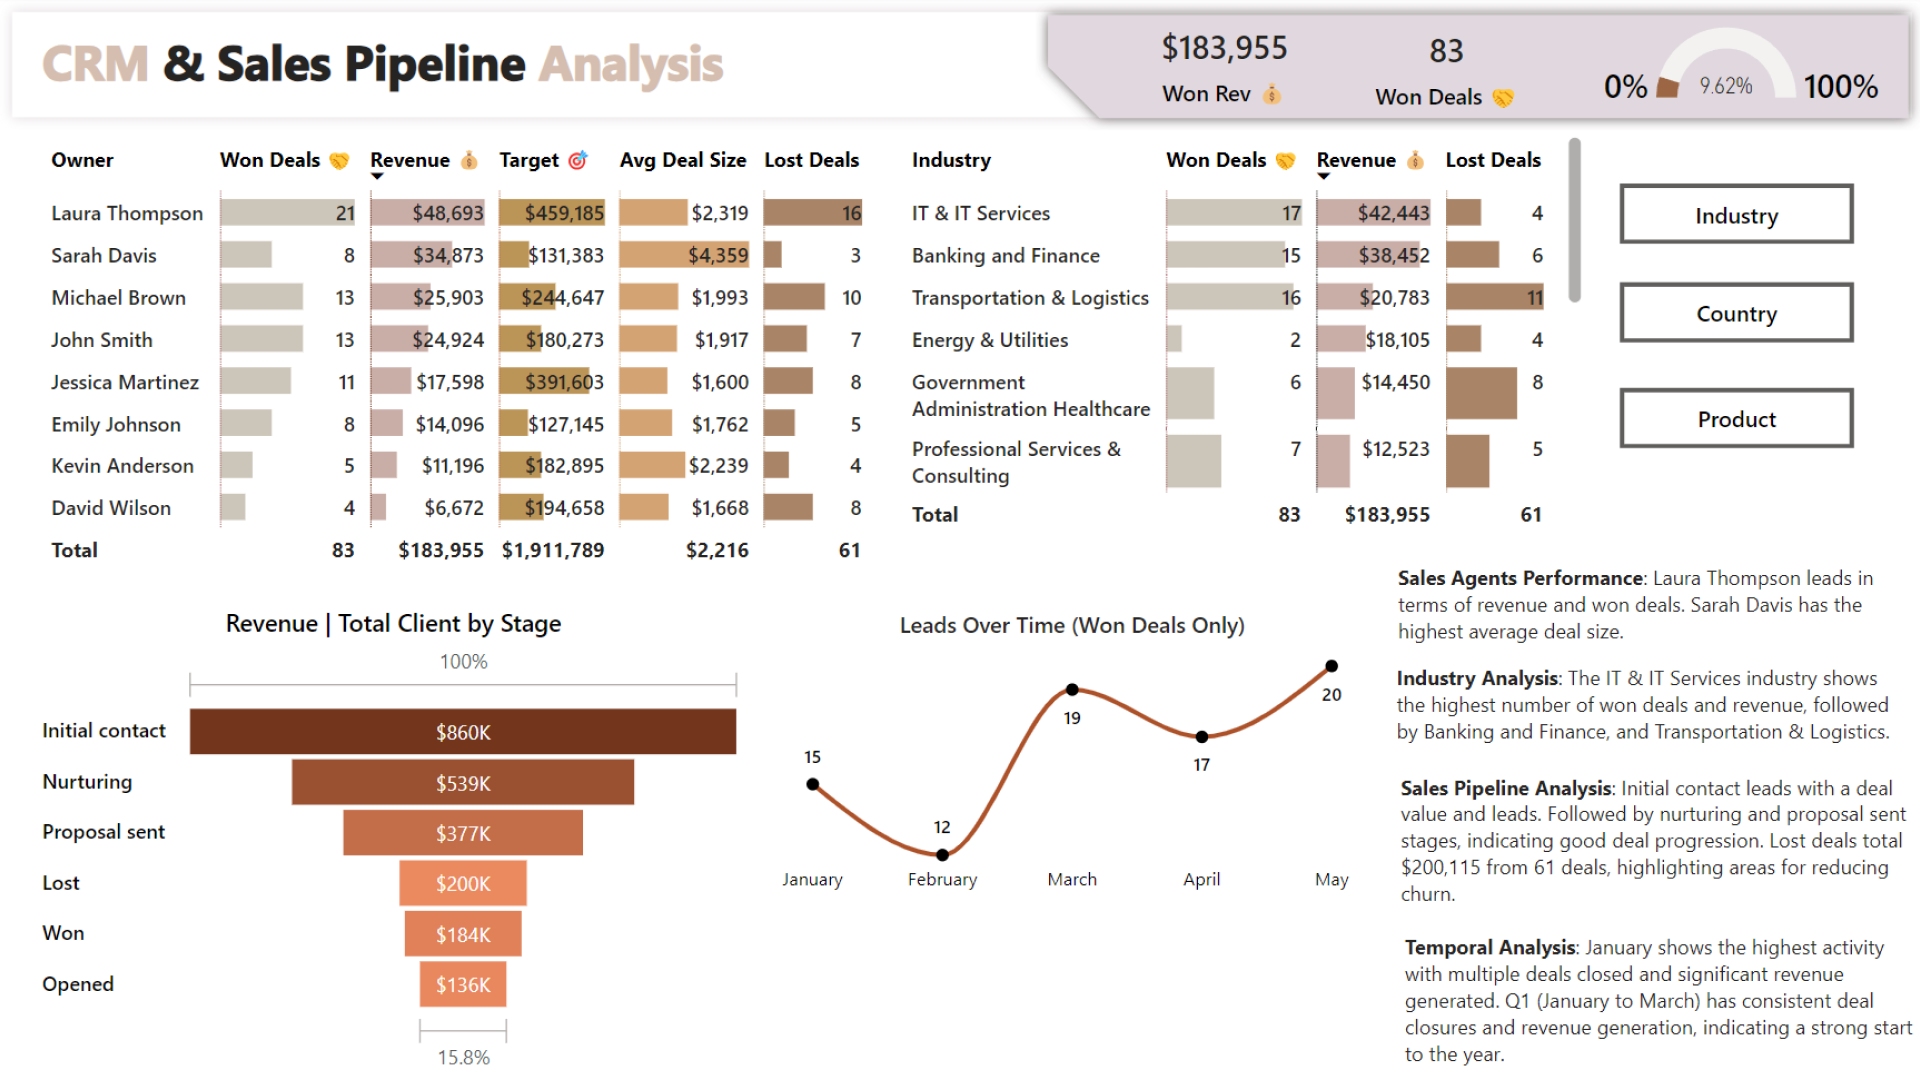
Report submitted for FP20 Analytics ZoomCharts Challenge 17 (July 2024). The report was built with the CRM & Sales Pipeline Analysis dataset and includes ZoomCharts custom Drill Down PRO visuals for Power BI.
Author's description:
The CRM and Sales Pipeline Analysis project transforms raw sales data into meaningful insights, empowering the business to optimize its sales processes, forecast revenues accurately, and build stronger customer relationships. This data-driven approach not only solves existing challenges but also sets the foundation for sustained growth and competitive advantage.
ZoomCharts visuals used
Need help?
Send your question to ZoomCharts assistant, and we will respond to you as soon as possible.
Contact UsMobile view allows you to interact with the report. To Download the template please switch to desktop view.

ZoomCharts Academy
Learn ZoomCharts with experts and become certified!
Go to Academy!
Was this helpful? Thank you for your feedback!
Sorry about that.
How can we improve it?


