659
CRM and Sales Analysis
CRM and Sales Analysis
More Report pages
Report Author: JWALA VARGHESE
659
Share template with others
Report submitted for FP20 Analytics ZoomCharts Challenge 17 (July 2024). The report was built with the CRM & Sales Pipeline Analysis dataset and includes ZoomCharts custom Drill Down PRO visuals for Power BI.
Author's description:
Key Insights :
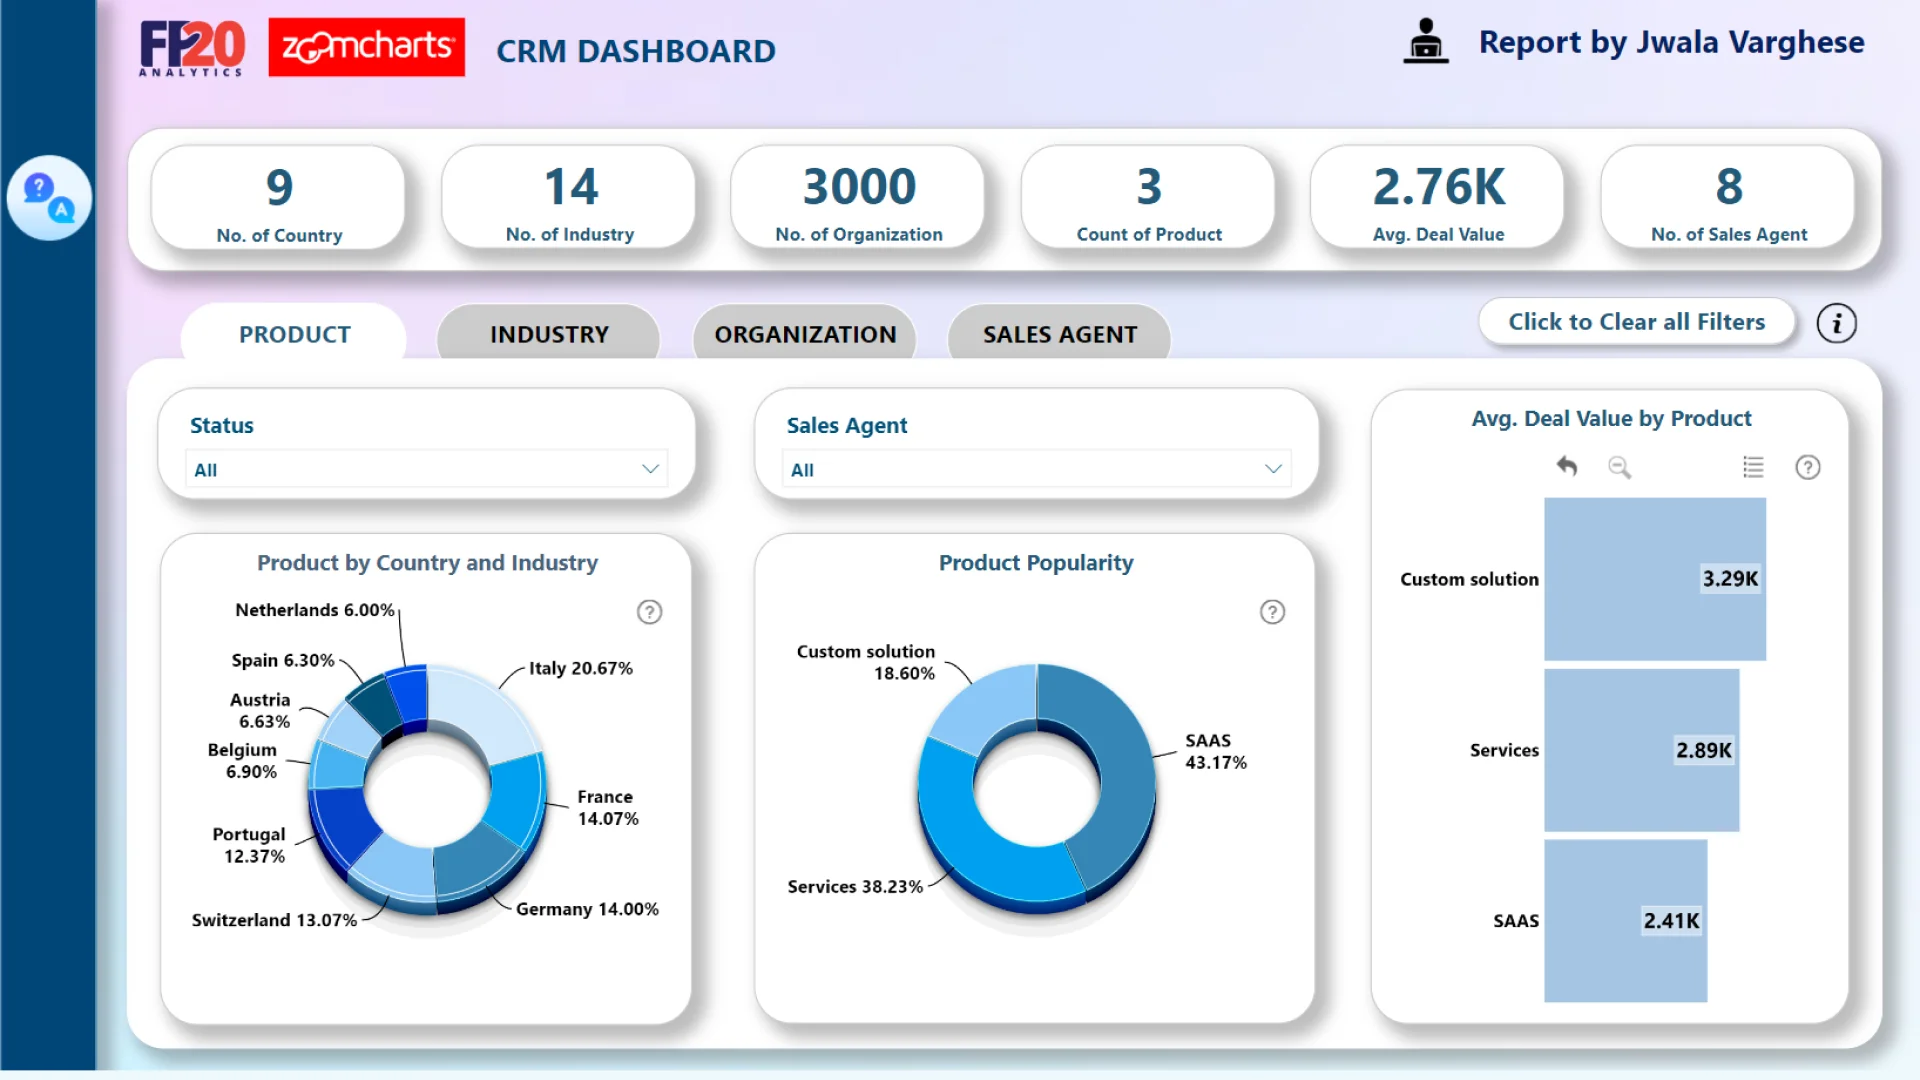
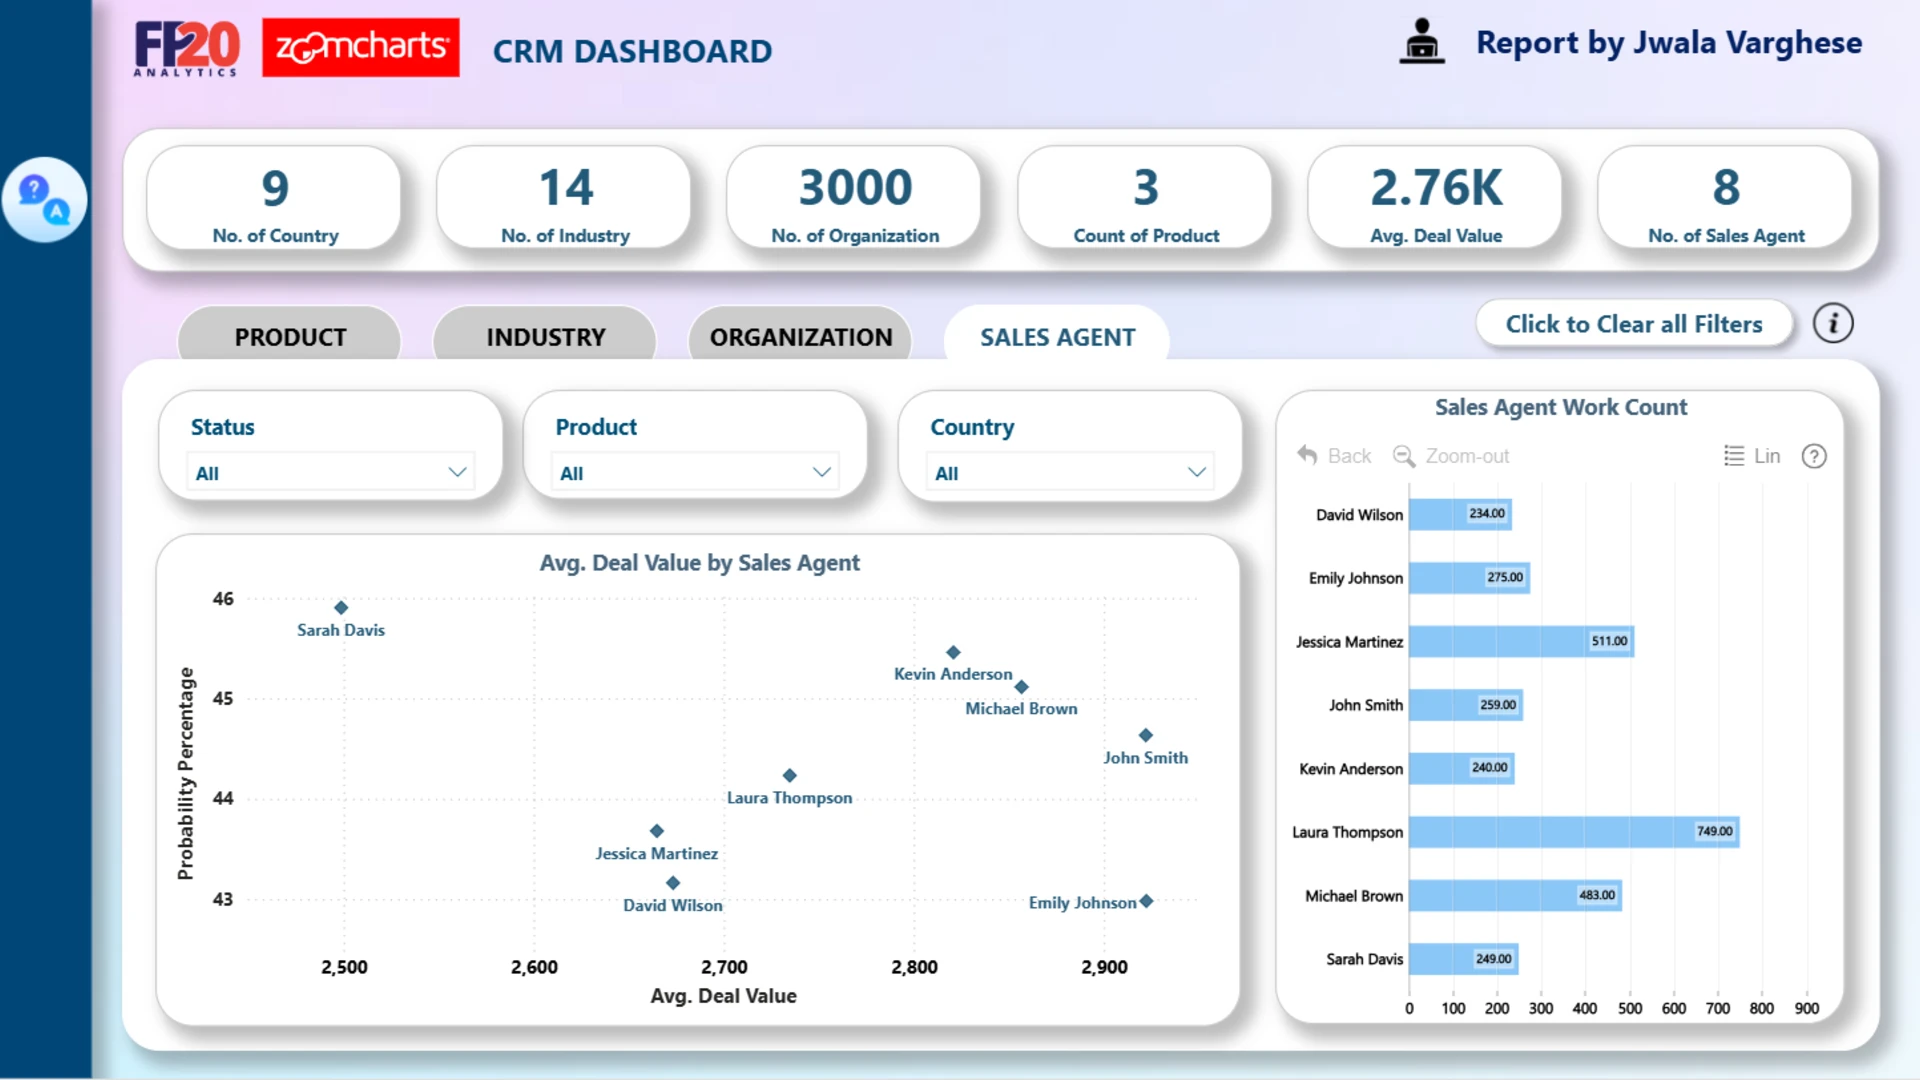
* Laura Thompson has the highest leads of 749 with average deal value of $2734. Emily Johnson and John Smith have the highest average deal value of $2.92k.
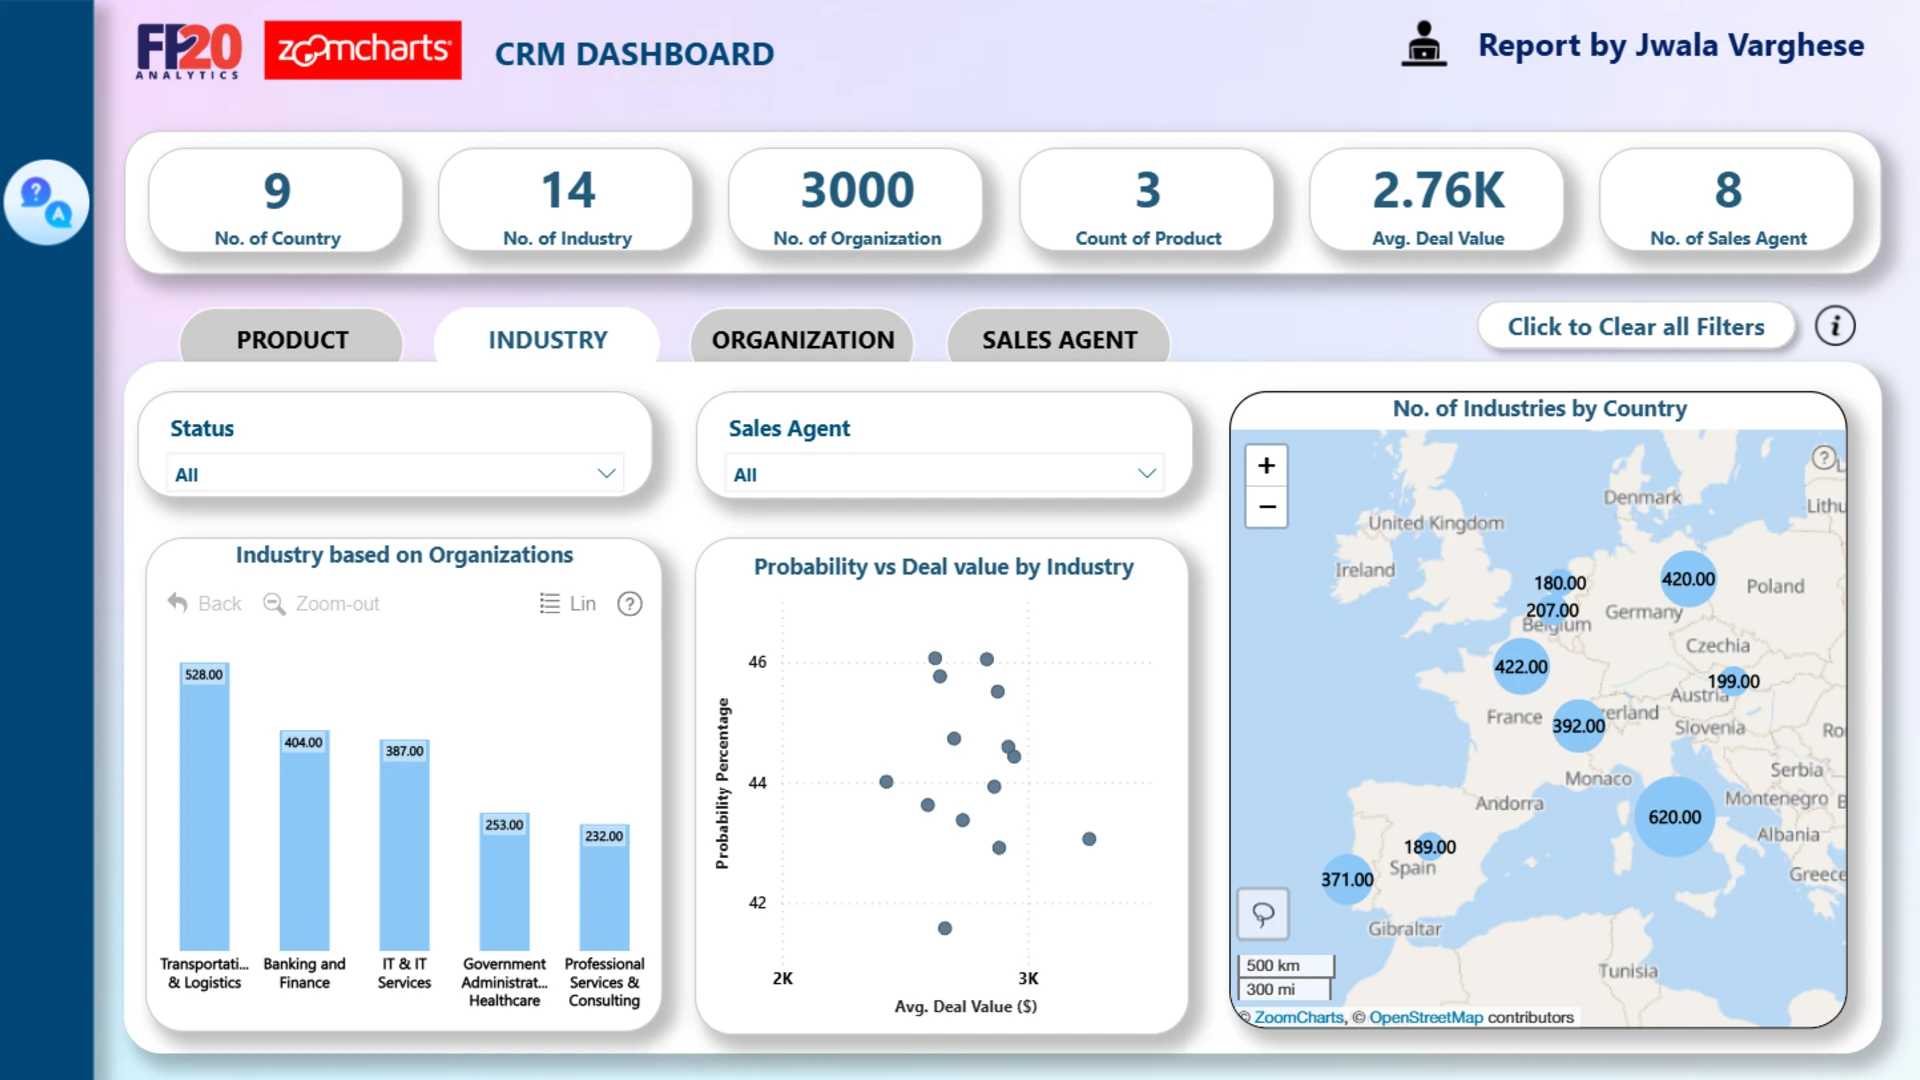
* Among the countries Italy has 620 leads and a conversion rate of 12%. whereas Netherlands has the lowest number of leads 180 but high conversion rate of 15%.
* Transportation and logistics has the highest percent of sales. In product wise analysis SAAS has 508k sales, services 626k and Custom solution 311k.
* There are observable fluctuations in Deal Values by month which suggests market volatility.
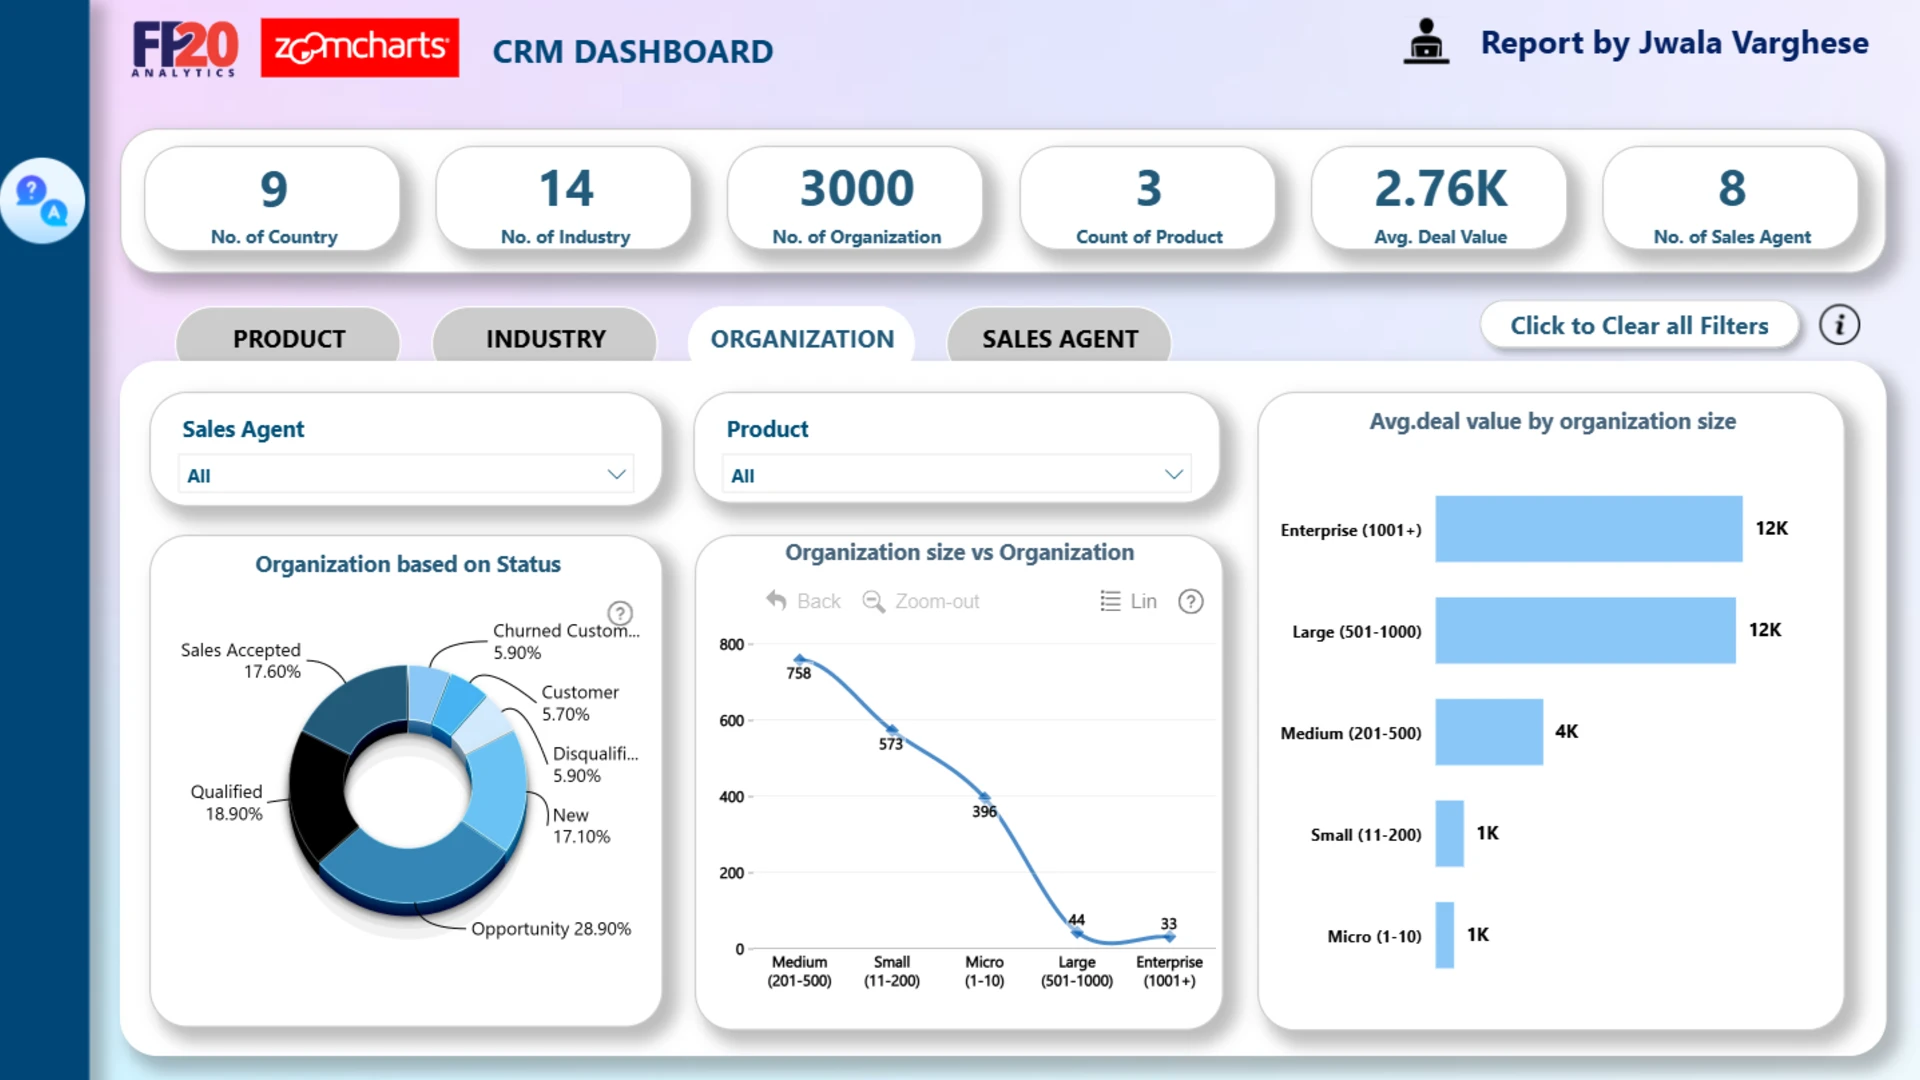
* Analysing by the size of Organization, Enterprises have the highest deal values and shortest sales cycle duration whereas micro scale organizations have lowest deal values but short sales cycle duration compared to others.
* Product based analysis shows SAAS leads with 43% followed by services with 38%, Custom solution tops in the average deal value range.
ZoomCharts visuals used
4U Report Challenges
Participate in data challenges, build and submit reports to get free template downloads.
Join CommunityMobile view allows you to interact with the report. To Download the template please switch to desktop view.

Was this helpful? Thank you for your feedback!
Sorry about that.
How can we improve it?