1363
Credit Risk Power BI Dashboard Example
Credit Risk Power BI Dashboard Example
More Report pages
Report Author: Ugochukwu Nwasuruba
1363
Share template with others
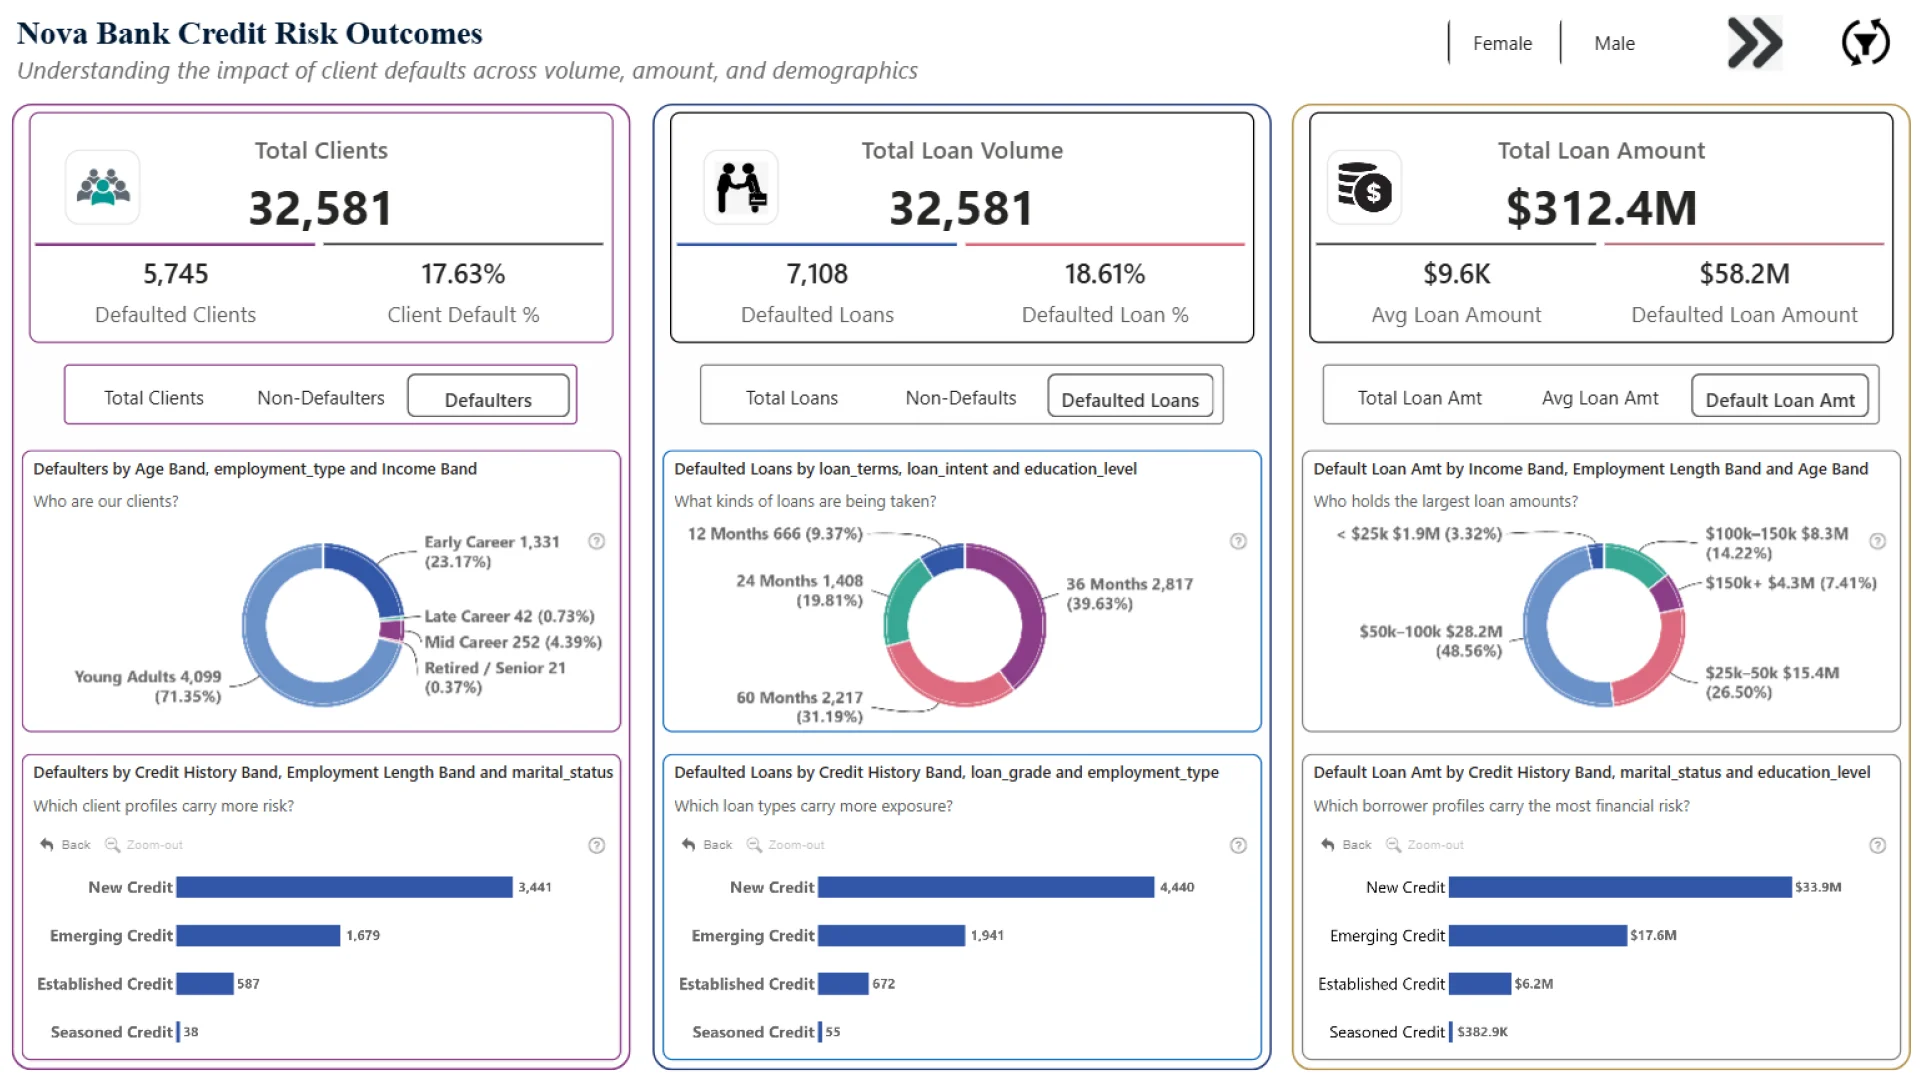
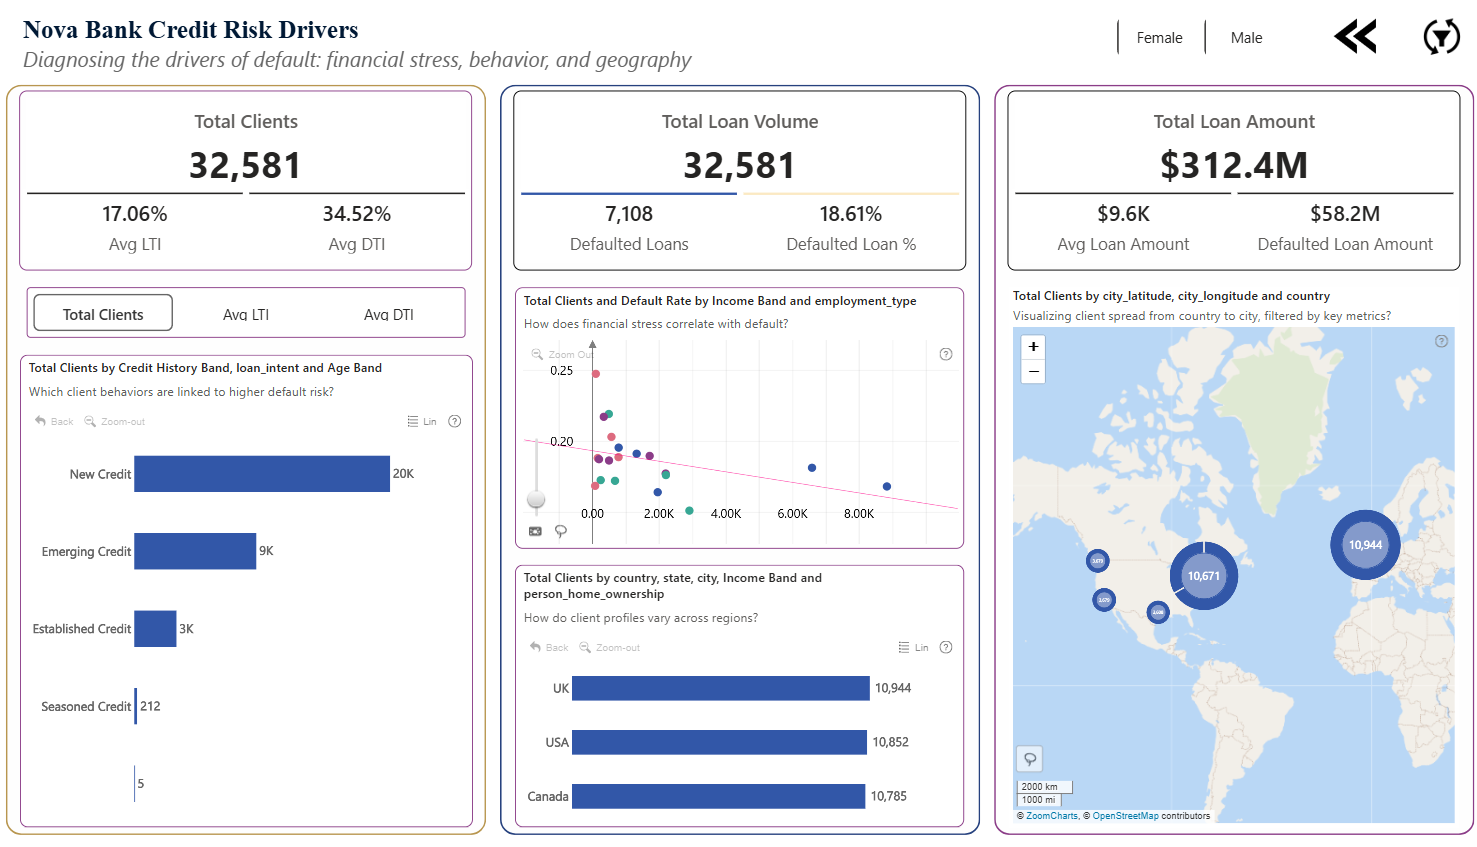
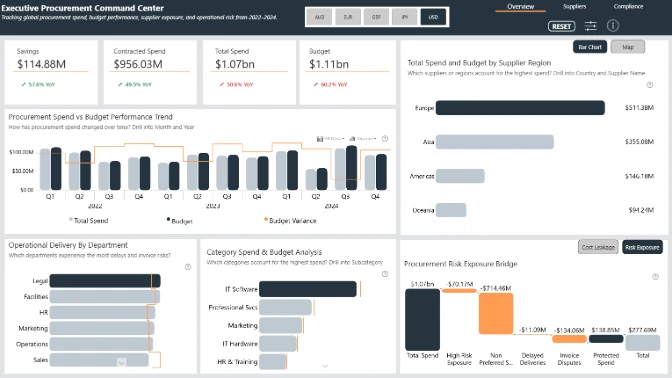
This Credit Risk Power BI Dashboard Example helps users analyze credit exposure, loan risk, borrower segments, and banking risk trends in an interactive Power BI report.
This Power BI report uses the Credit Bank Risk Dataset and features ZoomCharts Drill Down PRO custom visuals for Power BI in strong combination with native Power BI visuals. It was submitted to the Onyx Data DataDNA ZoomCharts Mini Challenge in September 2025.
Author's Description:
This dashboard delivers a multi-dimensional view of default behavior across financial, behavioral, and geographic factors.
Page 1 (Credit Risk Outcomes) measures the impact of defaults on client count, loan volume, and value while revealing demographic and geographic patterns to answer what happened.
Page 2 (Credit Risk Diagnostics) examines affordability metrics, credit history, loan purpose, and client segments to explain why it happened and maps geographic concentrations of risk. A client distribution view further segments borrowers by income, home ownership, and location to show who the clients are and where they are.
ZoomCharts visuals used
4U Report Challenges
Participate in data challenges, build and submit reports to get free template downloads.
Join CommunityMobile view allows you to interact with the report. To Download the template please switch to desktop view.
Was this helpful? Thank you for your feedback!
Sorry about that.
How can we improve it?