275
Credit Risk Analytics Dashboard 2
Share template with others
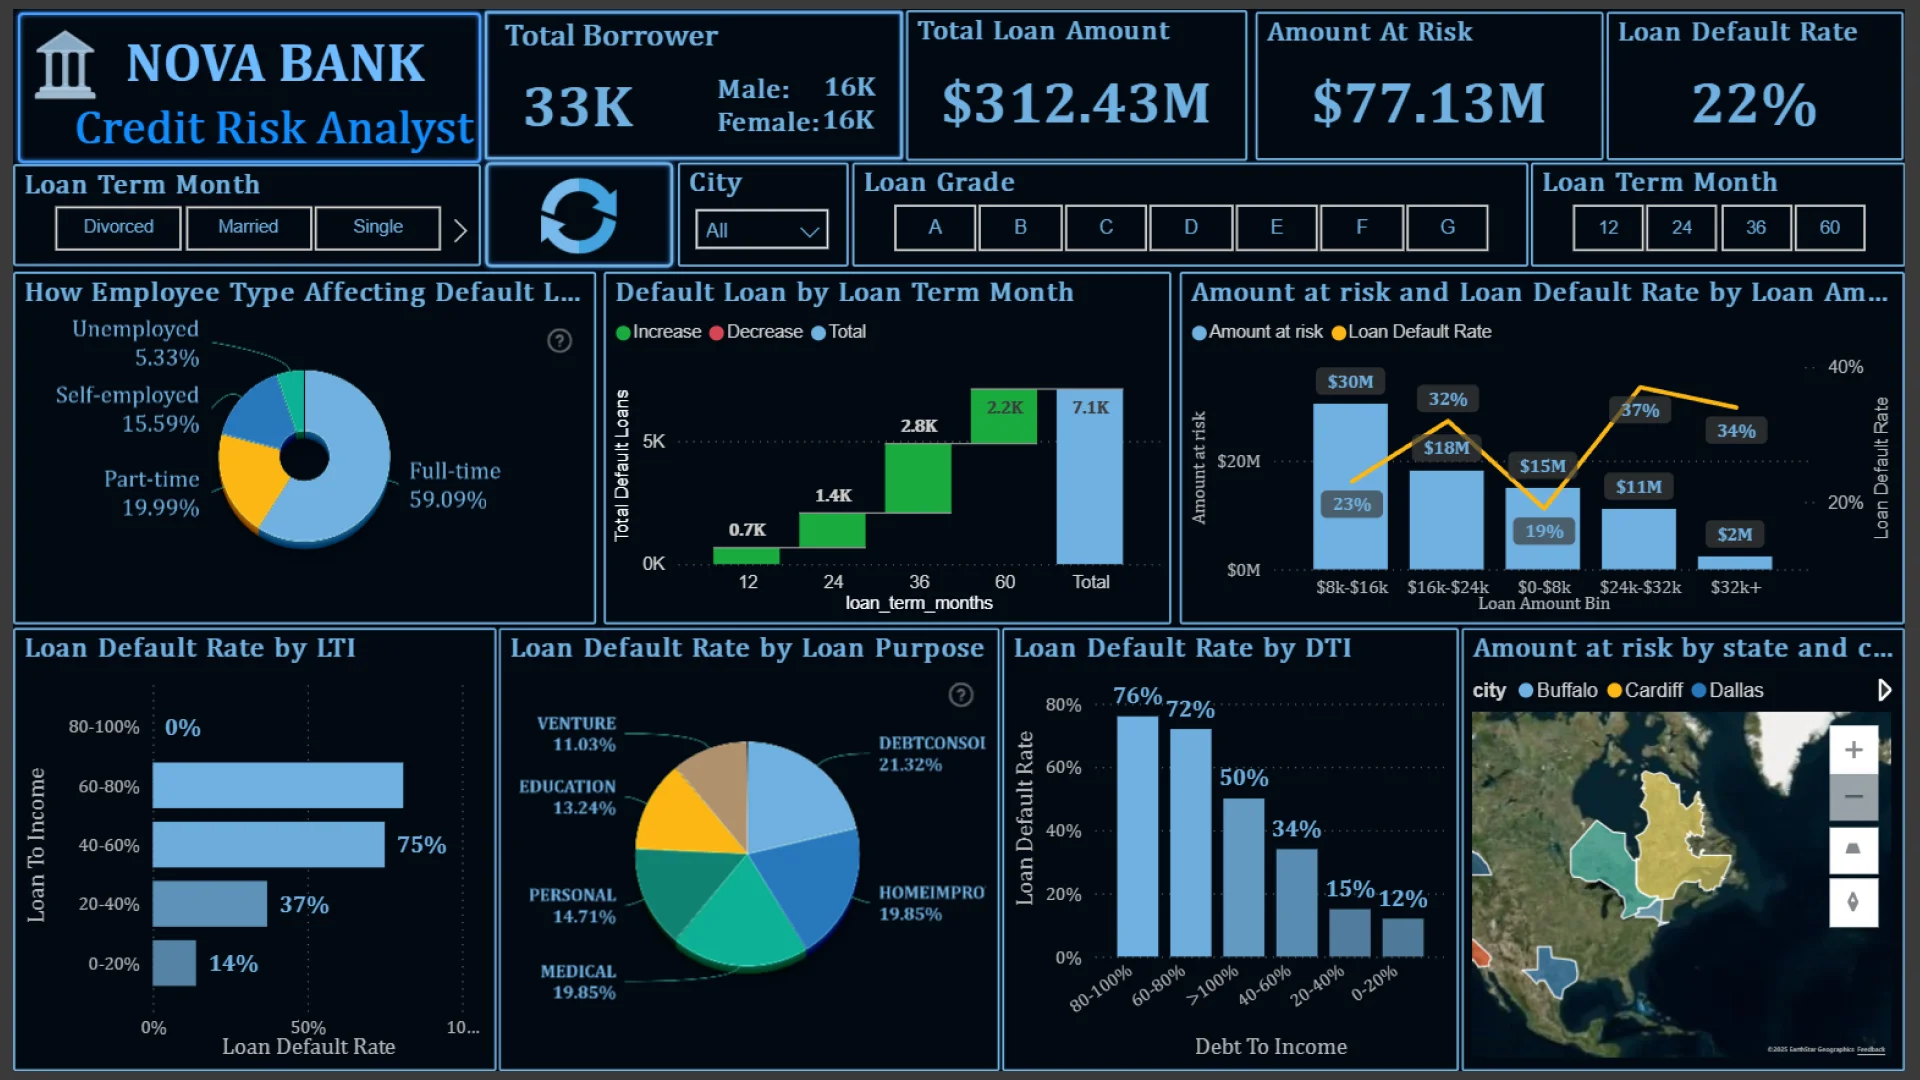
This Power BI report uses the Credit Bank Risk Dataset and features ZoomCharts Drill Down PRO custom visuals for Power BI. It was submitted to the Onyx Data DataDNA ZoomCharts Mini Challenge in September 2025.
Author's Description:
This report is my submission for the September 2025 Credit Risk Analytics Challenge, where I step into the role of a Nova Bank credit risk analyst to assess loan performance and support smarter lending decisions. The interactive Power BI dashboard, enhanced with ZoomCharts drill-down visuals, analyzes delinquency trends, identifies high-risk borrower segments, and highlights key drivers of default such as loan amount and interest rates. Designed for clarity, it features intuitive navigation, dynamic filters, and clear KPIs, turning complex financial data into actionable insights. This project showcases my expertise in data storytelling and building impactful BI solutions.
ZoomCharts visuals used
Need help?
Send your question to ZoomCharts assistant, and we will respond to you as soon as possible.
Contact UsMobile view allows you to interact with the report. To Download the template please switch to desktop view.

ZoomCharts Academy
Learn ZoomCharts with experts and become certified!
Go to Academy!
Was this helpful? Thank you for your feedback!
Sorry about that.
How can we improve it?

