8173
Credit Risk Analysis Dashboard
Credit Risk Analysis Dashboard
More Report pages
Report Author: Siddesh Pardeshi
8173
Share template with others
Summary
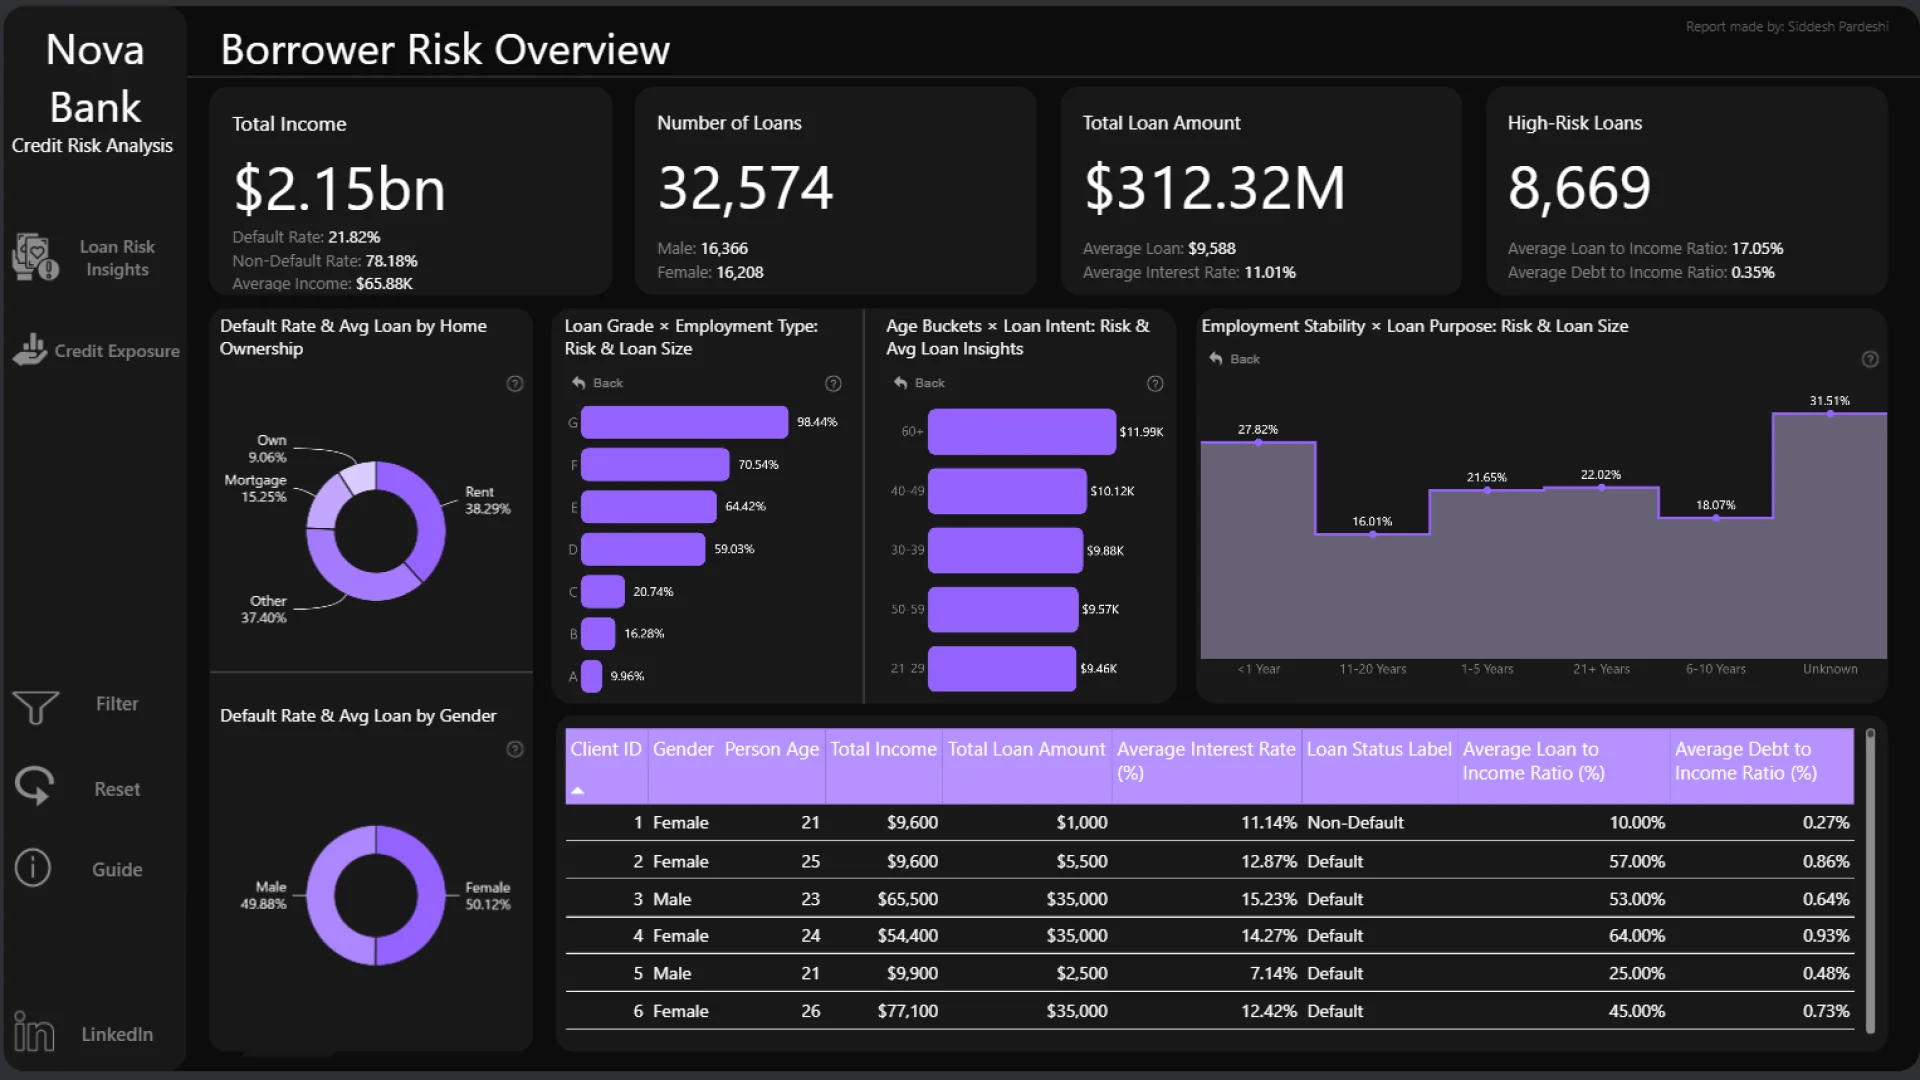
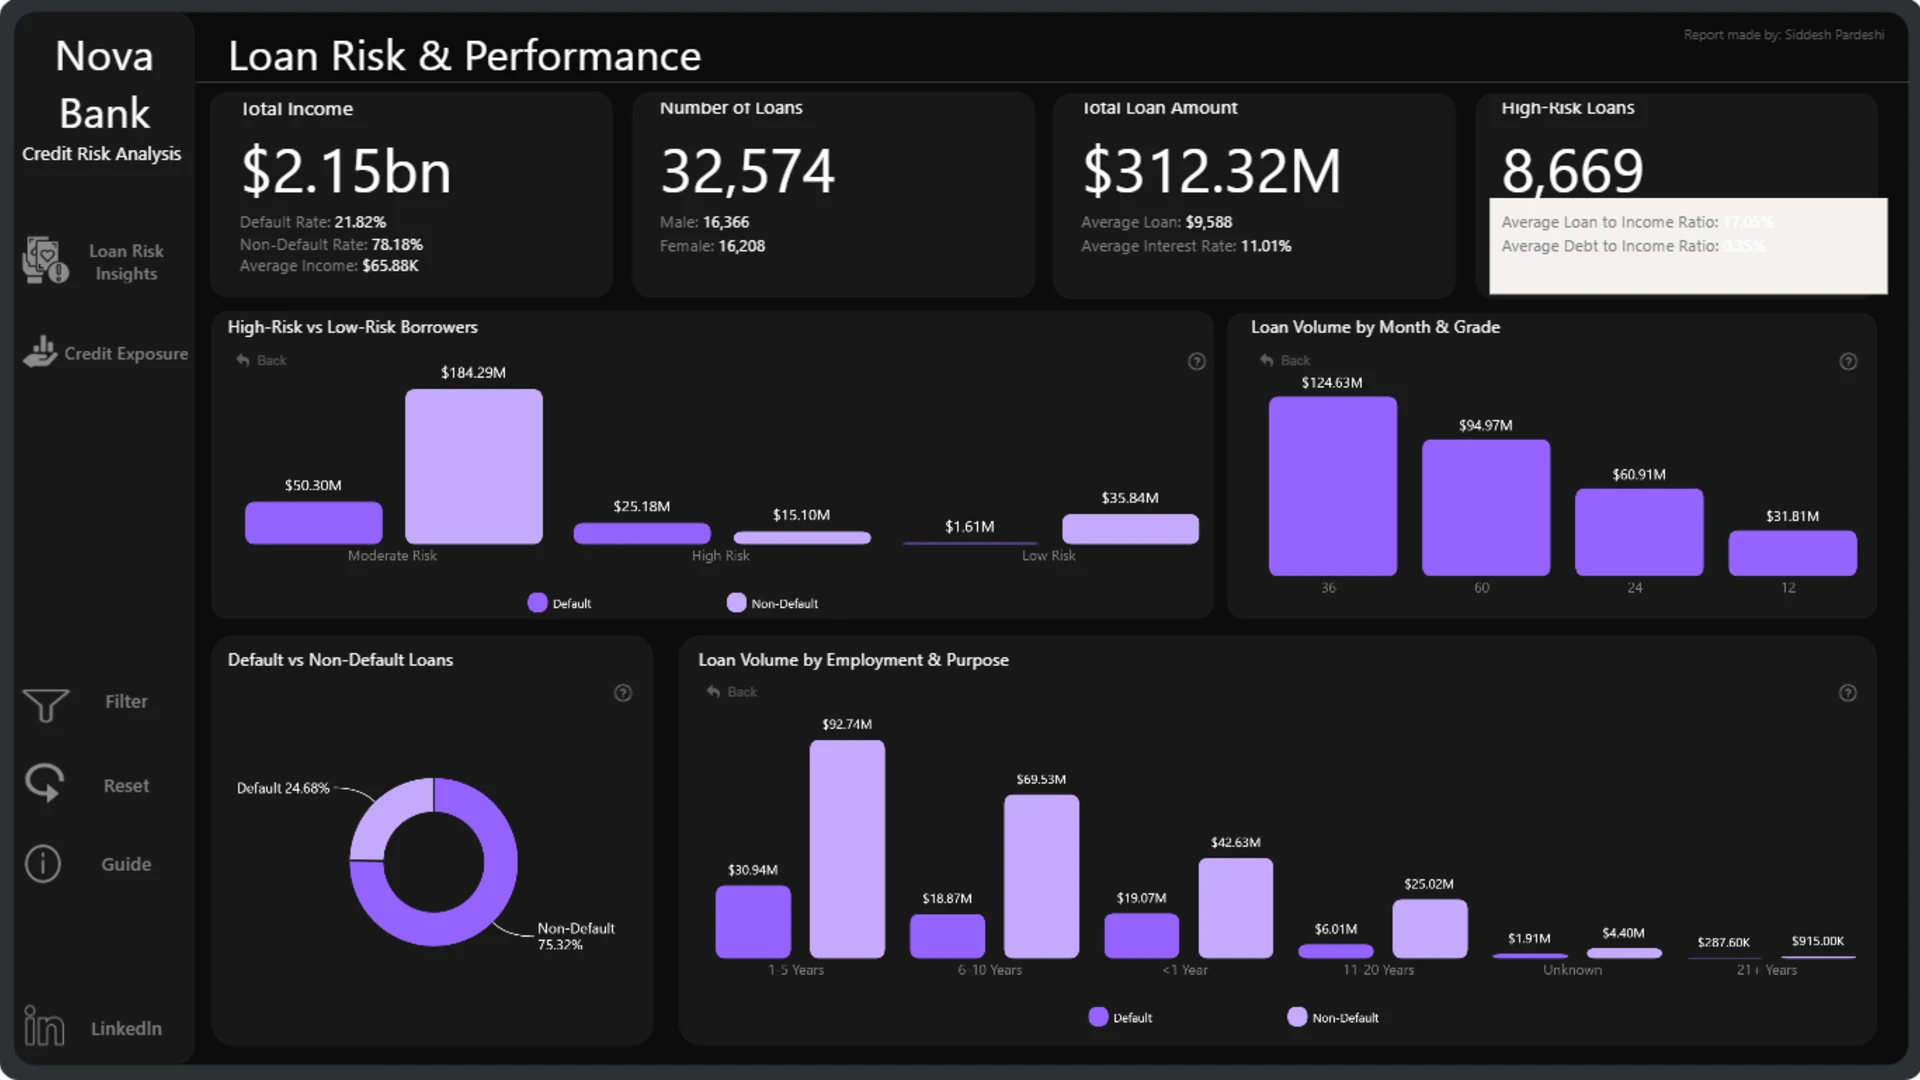
This Credit Risk Analysis Dashboard is a Power BI report example for exploring lending data and understanding the factors associated with credit risk. It brings portfolio, borrower, and loan information together, helping users compare risk patterns and identify areas that may require closer review.
Key Insights of the Credit Risk Analysis Dashboard
The dashboard presents credit risk data from several analytical perspectives. It can help users examine:
- Credit risk overview: understand how risk is distributed across the lending portfolio
- Borrower profiles: compare risk patterns across different customer groups
- Loan characteristics: explore how lending attributes relate to credit risk
- Risk patterns: identify factors and combinations associated with higher-risk cases
Interactive Power BI visuals make it easier to move from a portfolio-level overview to more focused analysis. Filters and chart selections help users compare segments and investigate the relationships behind the reported risk patterns.
How to Use This Credit Risk Analysis Dashboard
Use the available filters and click active chart elements to narrow the data and explore credit risk from different perspectives. Selecting a borrower group, loan category, or other data point updates the related visuals where cross-filtering is enabled.
Download the .pbix file to review the report structure, calculations, visual settings, and interactions, or adapt the dashboard to your own credit risk data.



4U Report Challenges
Participate in data challenges, build and submit reports to get free template downloads.
Join CommunityMobile view allows you to interact with the report. To Download the template please switch to desktop view.
How to use a PBIX template
Preview the interactive report, download the PBIX file, open it in Power BI Desktop, and replace the same data connection with your own dataset.
Preview and download
Explore the report online and download the PBIX template file.
Open in Power BI Desktop
Open the downloaded PBIX file in Power BI Desktop.
Connect your data
Replace the sample data source with your own dataset.
Refresh and adjust
Refresh the model and update fields or visual were needed.
Save and share
Save your report and publish it for your audience.


