403
Consumer Financial Complaints Report 23
Consumer Financial Complaints Report 23
Report Author: Issa Kareem Oyaifo
403
Share template with others
This Power BI report uses the Consumer Financial Complaints Dataset and features ZoomCharts Drill Down PRO custom visuals for Power BI. It was submitted to the Onyx Data DataDNA ZoomCharts Mini Challenge in October 2025.
Author Description:
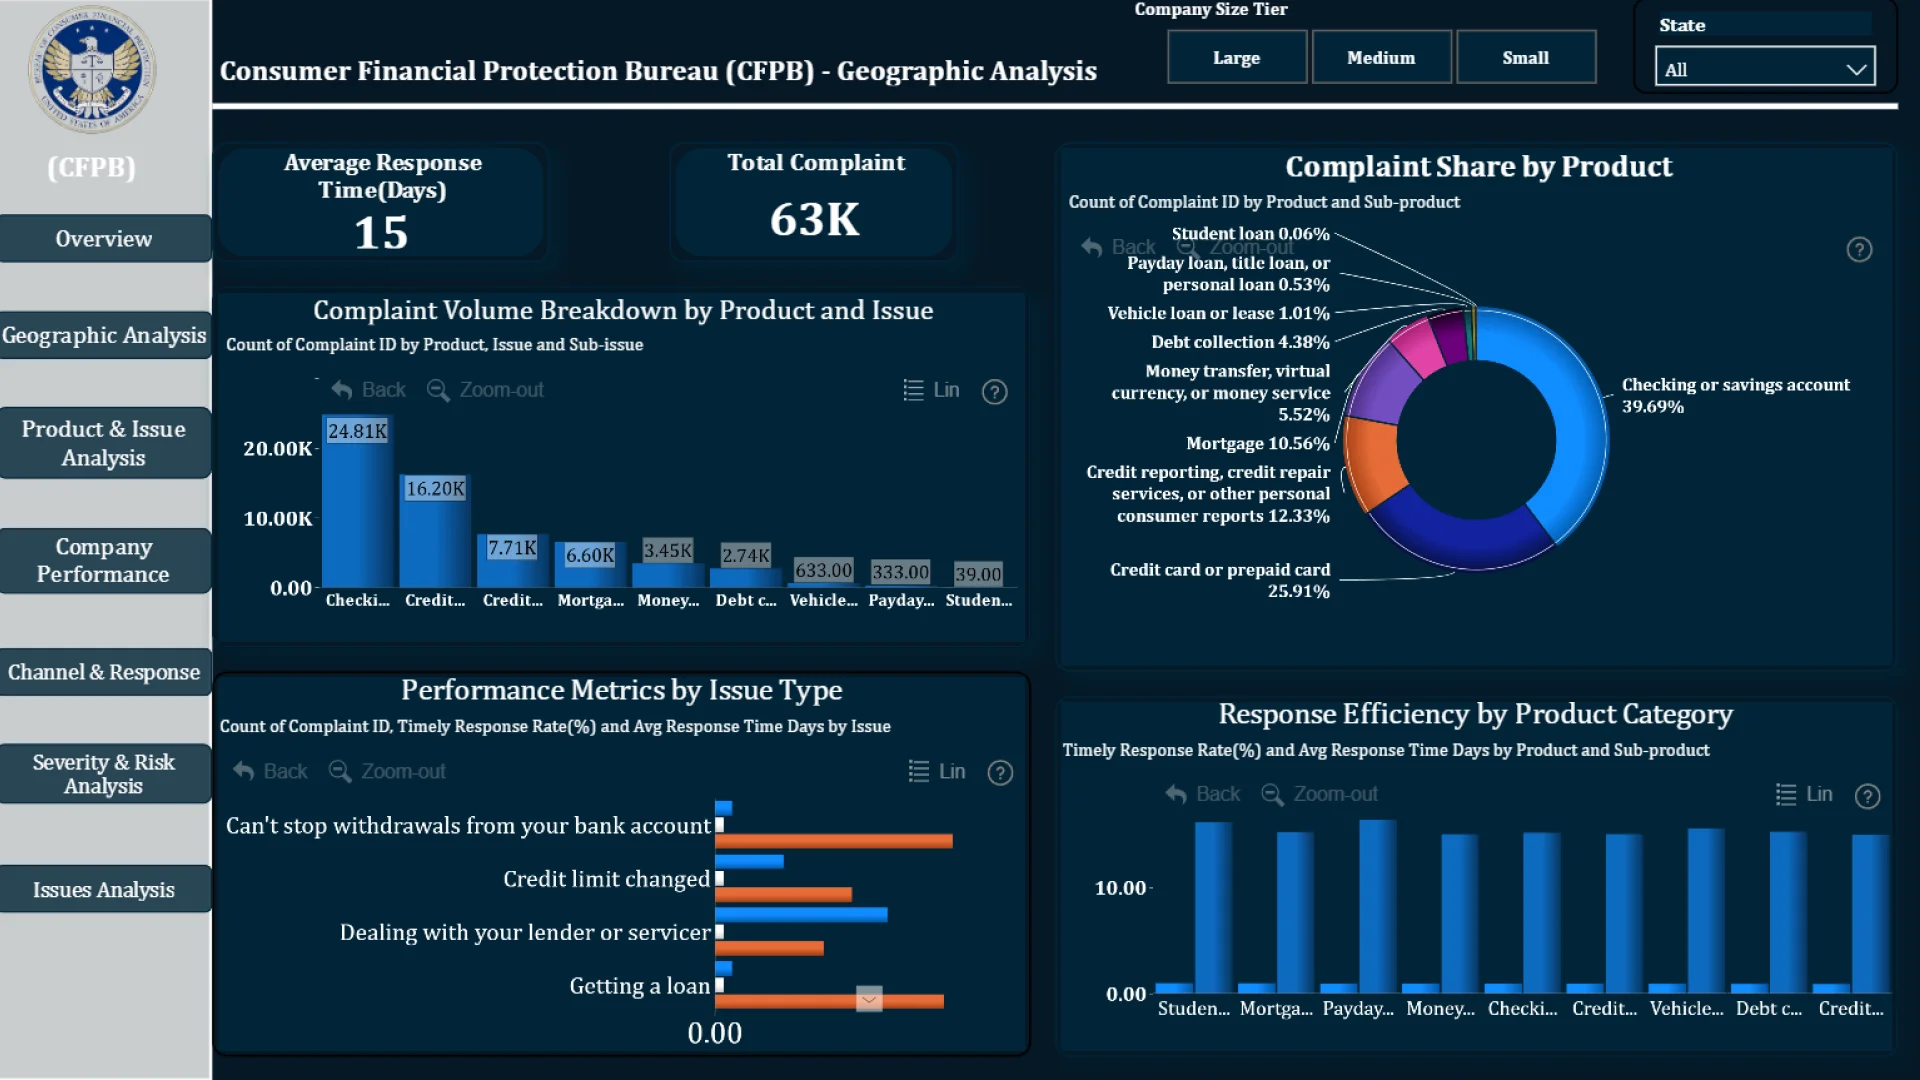
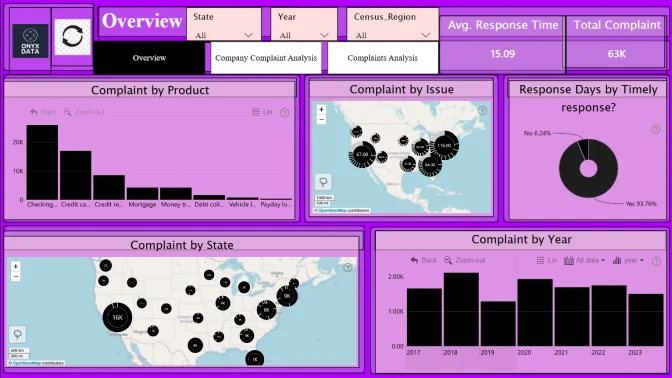
This report provides a comprehensive analysis of consumer complaints data, focusing on product performance, issue trends, and company response effectiveness. It enables users to explore complaint patterns by product, issue type, and submission channels, while evaluating company performance through key indicators such as Timely Response Rate, Average Response Time, Reputation Score, and Complaint Severity. Interactive visuals including drill-down combo charts, matrices, scatter plots, and treemaps allow for detailed insights into complaint handling efficiency, regional performance, and customer satisfaction levels. The report supports data-driven decisions by highlighting areas requiring operational improvement and reinforcing transparency in complaint management.
ZoomCharts visuals used
Need help?
Send your question to ZoomCharts assistant, and we will respond to you as soon as possible.
Contact UsMobile view allows you to interact with the report. To Download the template please switch to desktop view.
Was this helpful? Thank you for your feedback!
Sorry about that.
How can we improve it?