982
Complaint Resolution Analysis Dashboard
Complaint Resolution Analysis Dashboard
More Report pages
Report Author: Yar Zar Linn
982
Share template with others
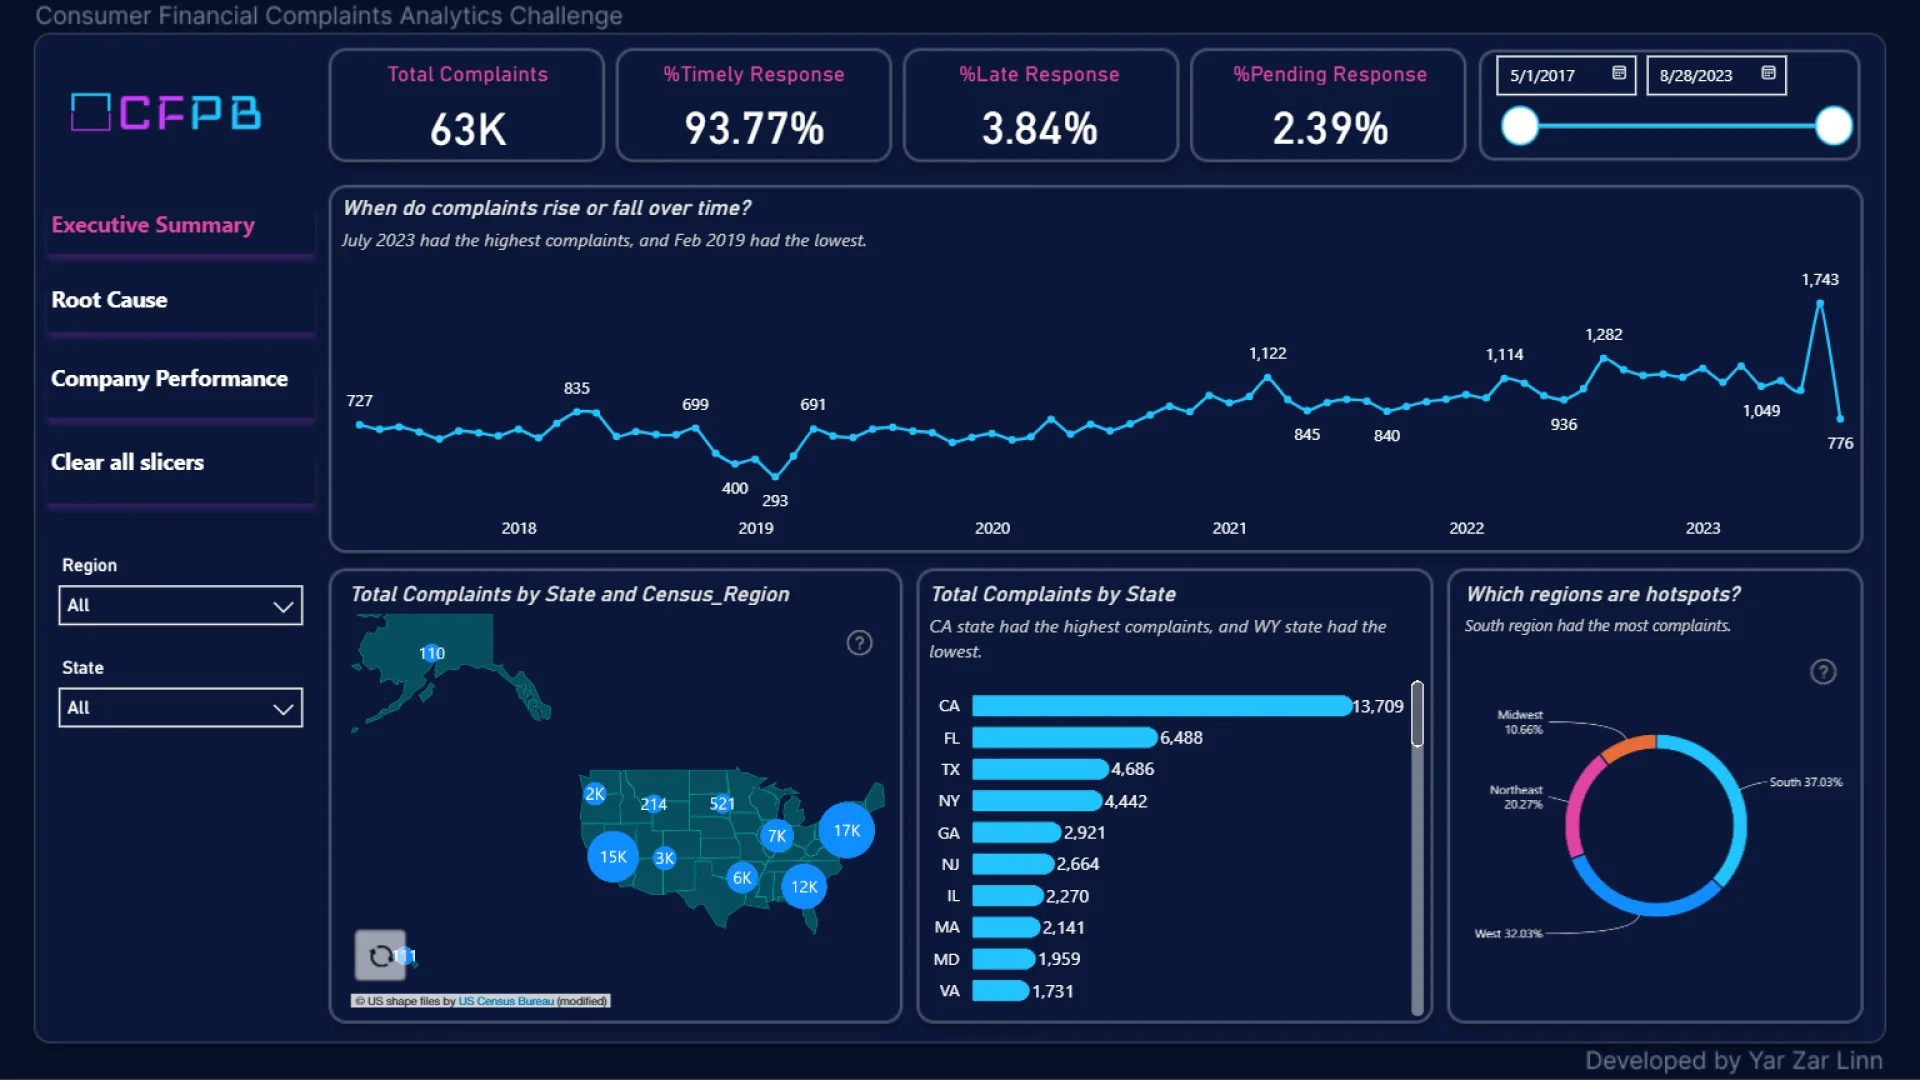
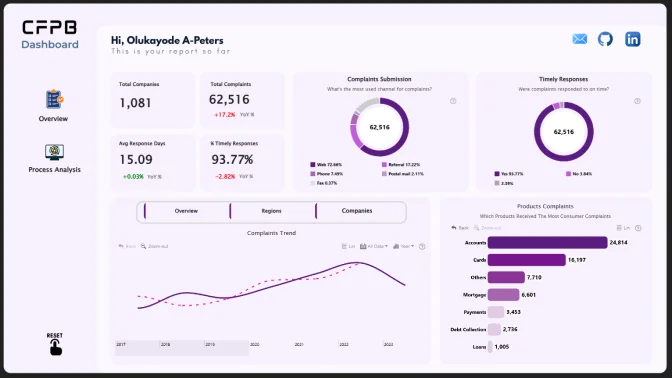
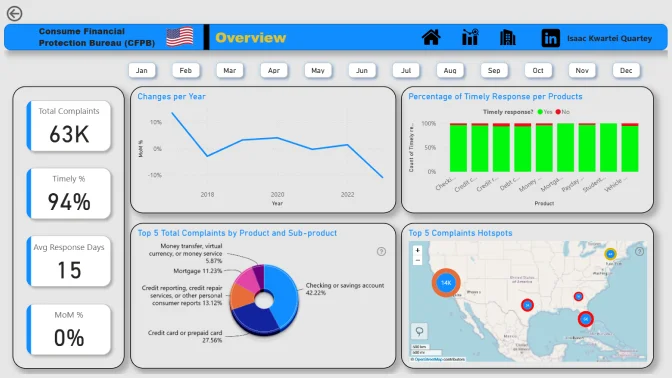
This Complaint Resolution Analysis Dashboard helps users analyze how consumer financial complaints are handled, resolved, and affected by submission channels.
This Power BI report uses the Consumer Financial Complaints Dataset and features ZoomCharts Drill Down PRO custom visuals for Power BI. It was submitted to the Onyx Data DataDNA ZoomCharts Mini Challenge in October 2025.
Author Description:
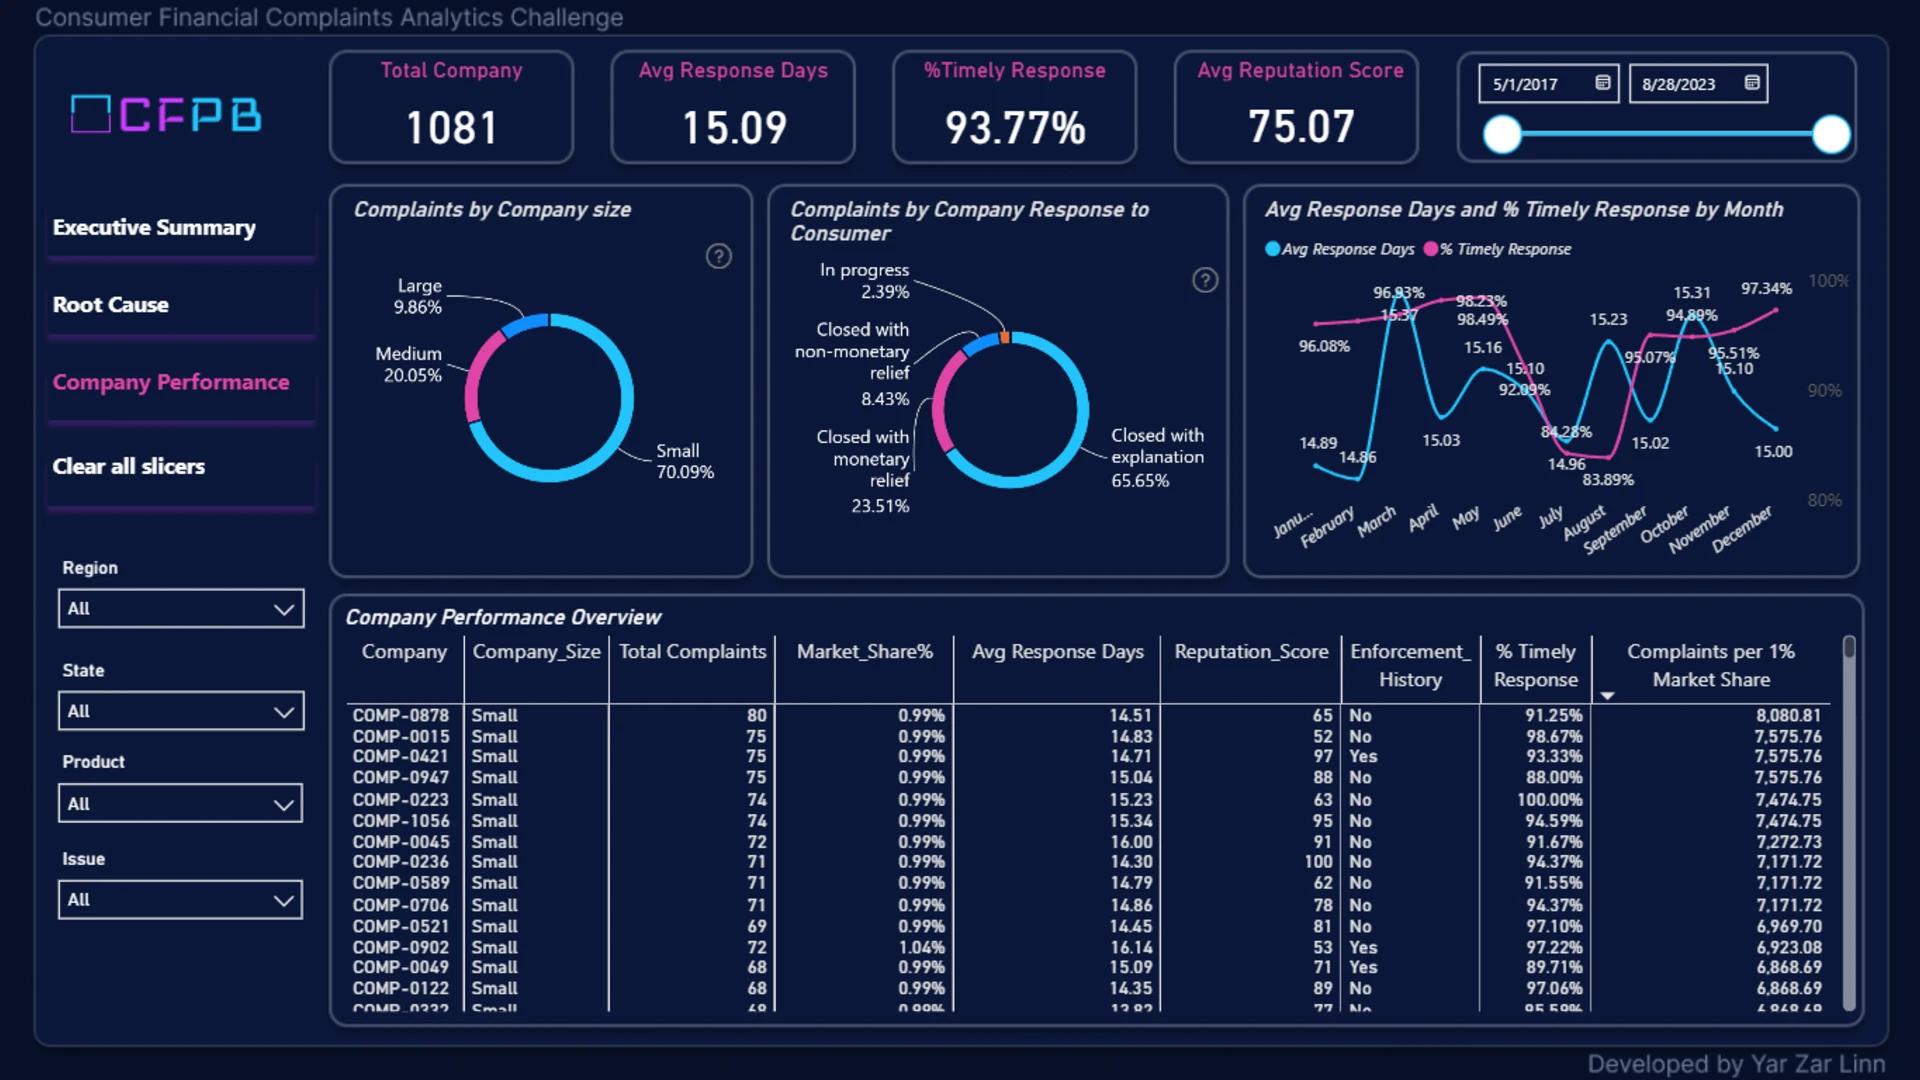
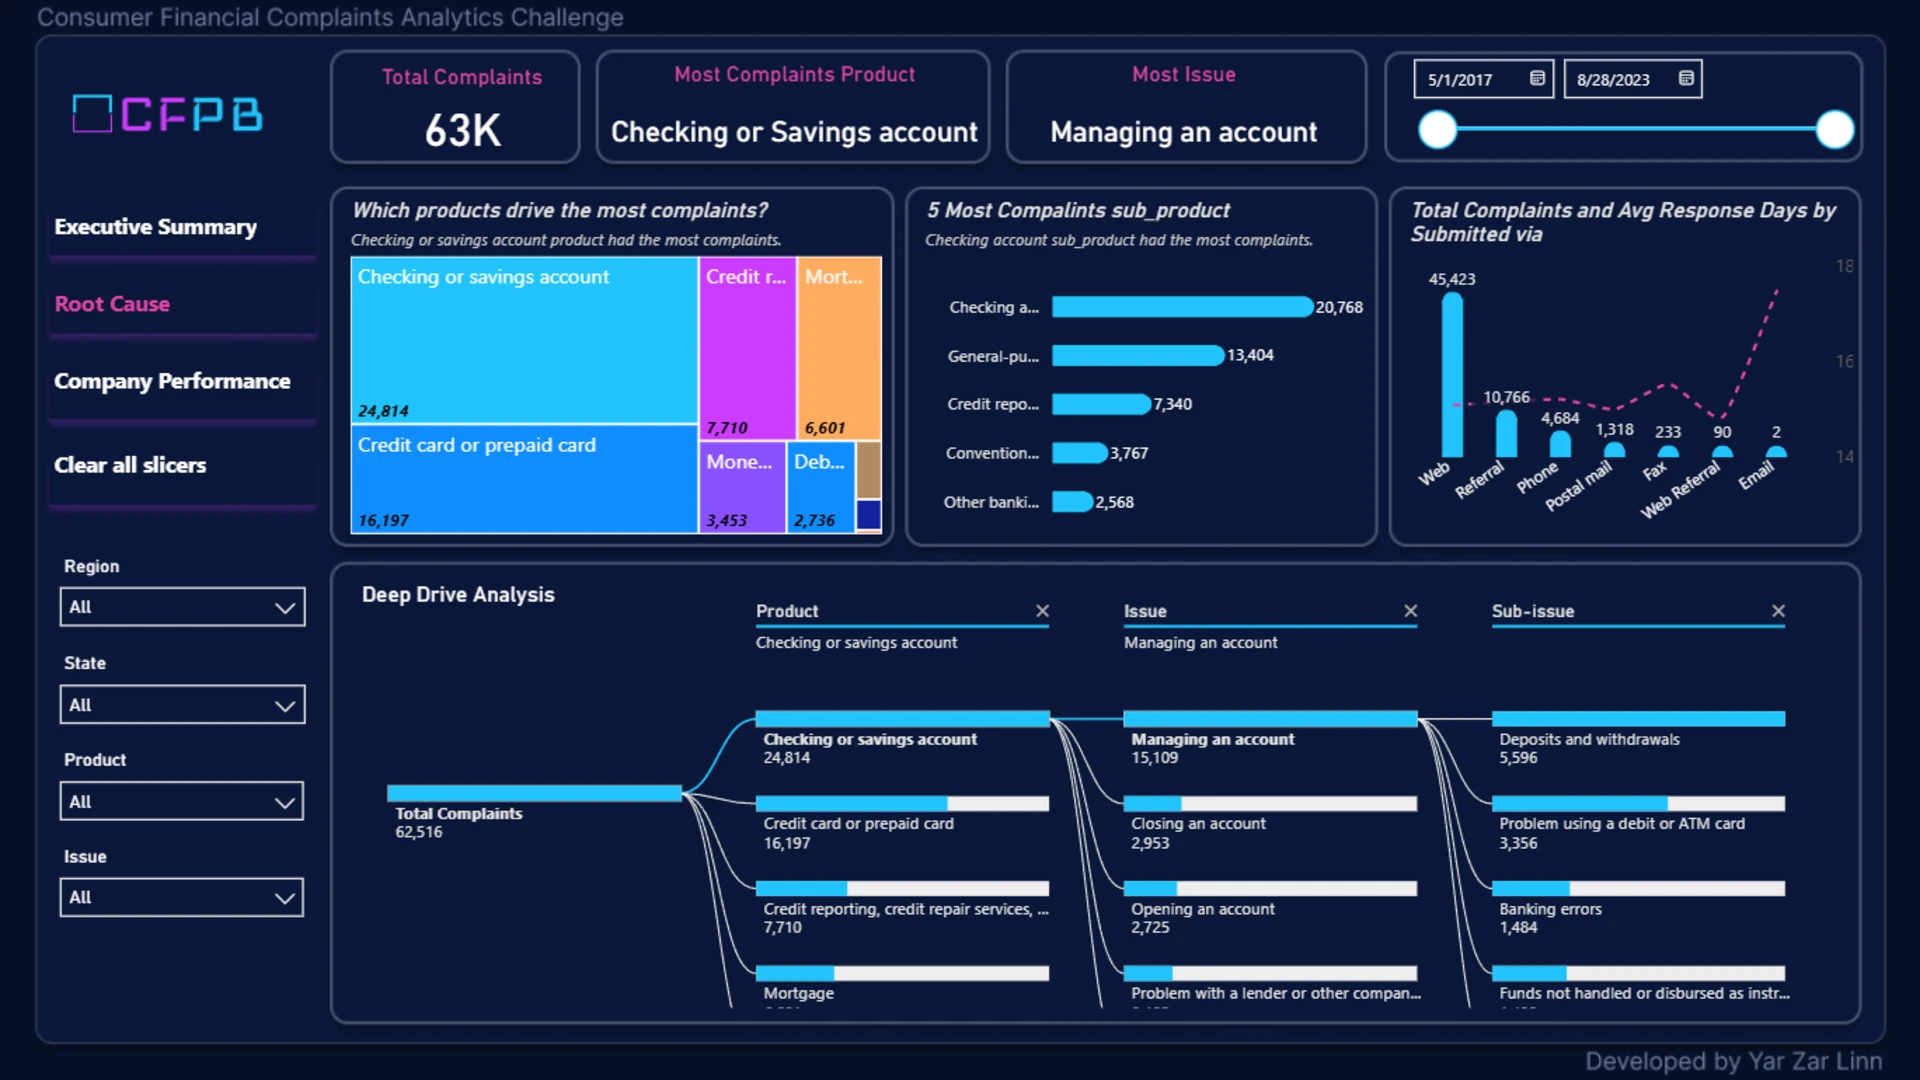
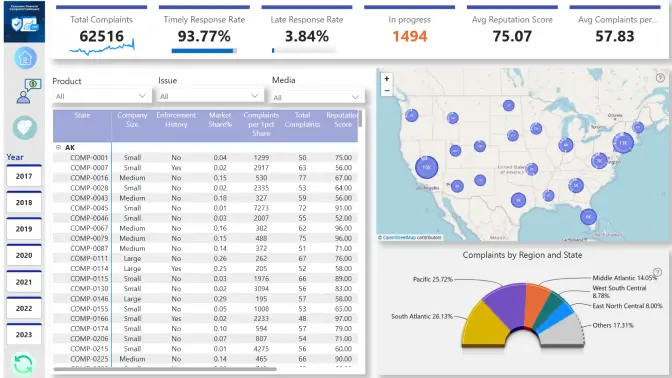
For the October 2025 Onyx Data Challenge, I analyzed over 63,000 consumer complaints submitted to the CFPB between 2017 and 2023 using the Consumer Financial Complaints Dashboard. Complaint volumes rose steadily after 2020, peaking in mid-2023, with the Southern region and states like California, Florida, and Texas reporting the highest activity. Checking and savings accounts, along with credit cards and credit reporting, drove most complaints, primarily related to account management issues. Most submissions came through digital channels, and while companies showed strong responsiveness (93.8% timely rate), smaller firms accounted for over 70% of complaints, highlighting resource and compliance challenges.
4U Report Challenges
Participate in data challenges, build and submit reports to get free template downloads.
Join CommunityMobile view allows you to interact with the report. To Download the template please switch to desktop view.
Was this helpful? Thank you for your feedback!
Sorry about that.
How can we improve it?