logo
For Power BI
  • Products
    • Custom Visuals for Power BI
    • Report Templates
  • Resources

      Resources

    • Documentation
    • Report Examples
    • Blog
    • Webinars
    • Video Tutorials
    • Visuals Gallery

    Support

    • ZoomCharts Assistance
    • Contact Sales
    • Contact Support
    • FAQ

    Challenges

    Challenges

    Improve your report creation skills by participating in free challenges for report creators.

    Learn more
    Get Developer License
  • Services
    • Power BI Report Development
    • Custom Visual Development
  • Challenges
  • Pricing
    • Custom Visuals for Power BI
    • Report Templates
Subscribe
Subscribe
Get it now
Go back

Contents

Contest logo
Contest logo
Contest logo
Contest logo
Try Free Now
Go back

FP20 Analytics November 2024 Challenge

Report Author: Gomathi Latha

59

Candy Market Share Analysis 9

Report
Report Interact

Pie Donut Research

Share template with others

Report submitted for the FP20 Analytics ZoomCharts Challenge, November 2024. The report was built using the Candy Market Share dataset and includes ZoomCharts custom Drill Down PRO visuals for Power BI.

Author's description:

Summary of Report

Data Preparation:

  • Explored the provided dataset, performed data cleaning and transformation using Power Query.
  • Calculated a custom month column to enhance visual clarity in the report.

Visualizations and Features:

  • Used a combination of bar charts, pie charts, donut charts, line charts, slicers, and card visuals.
  • Incorporated ZoomCharts Drill Down Visuals for intuitive exploration.
  • Added bookmarks for user-friendly navigation and enhanced interactivity.

Key Insights:

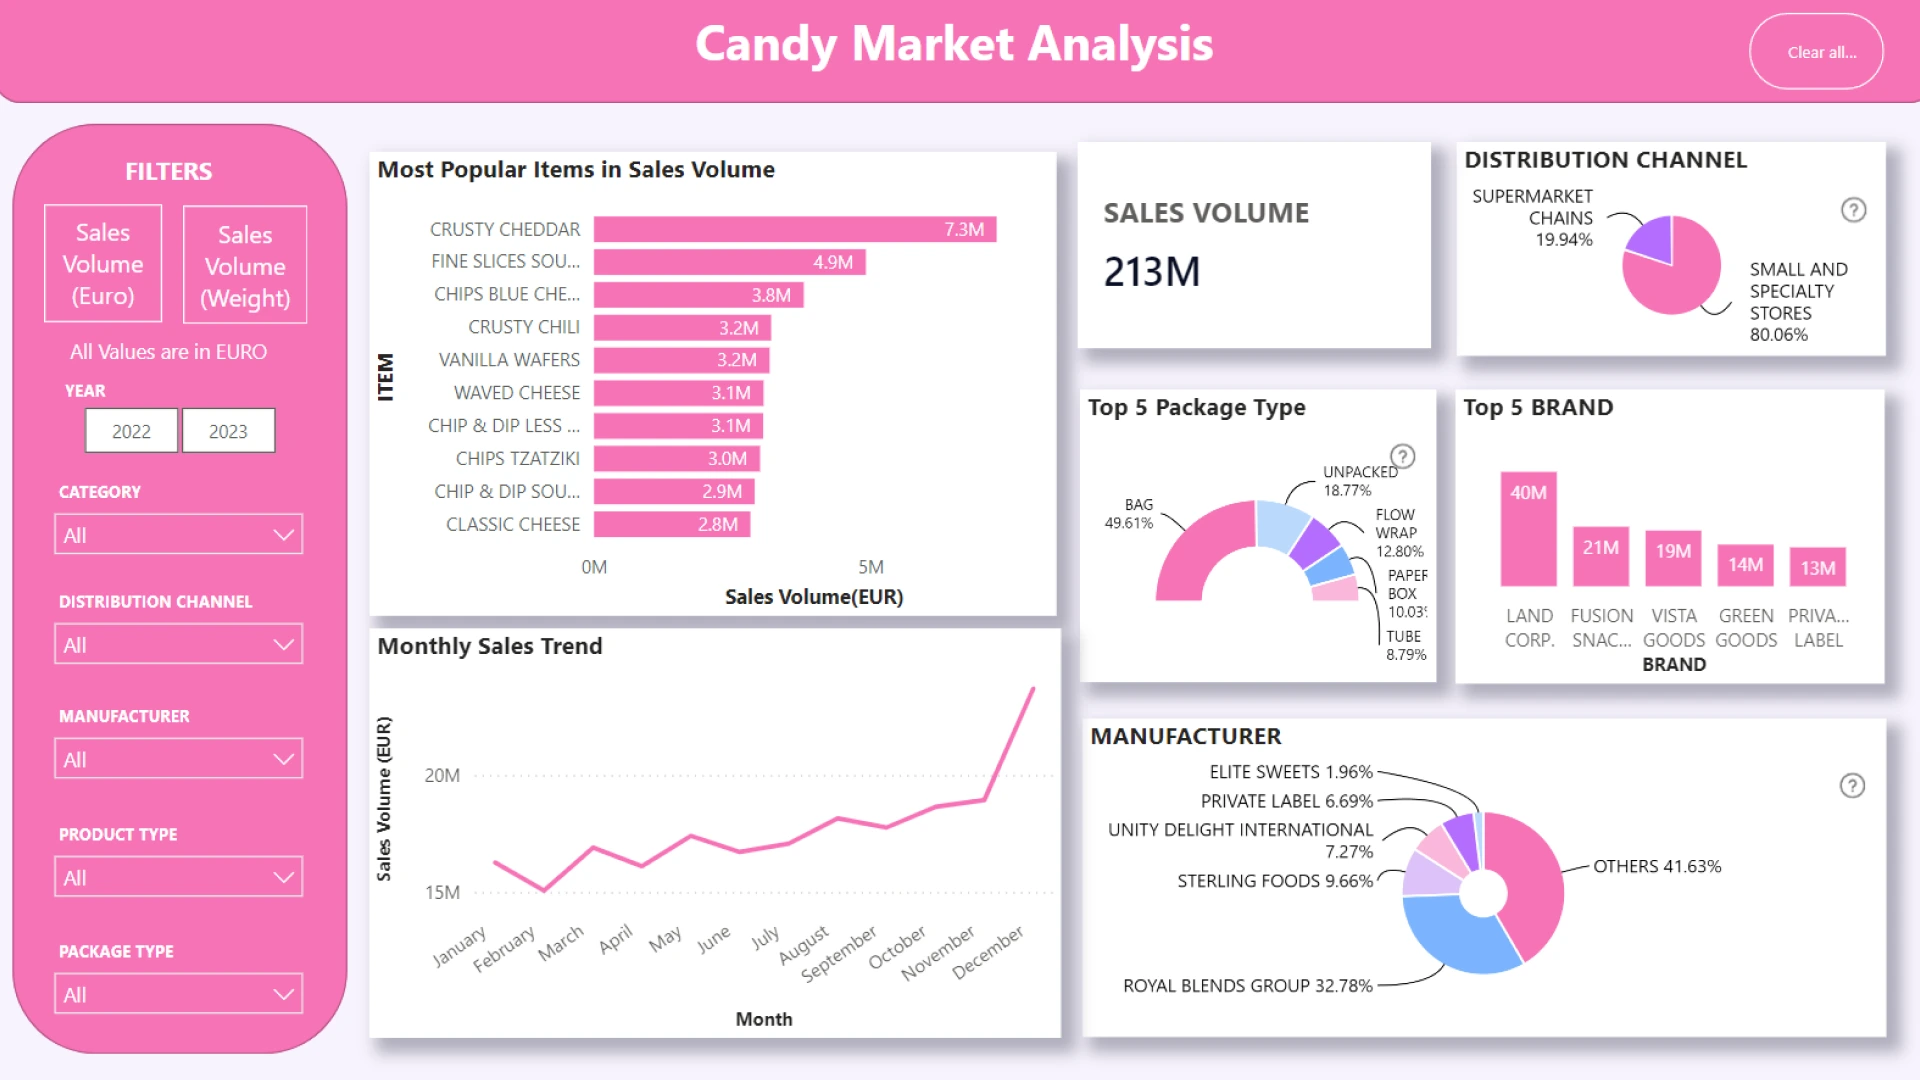
  • Top 10 Candy Items: Highlighted by sales volume (weight and revenue) for 2022 and 2023.
  • Monthly Sales Trend: Observed spikes in November and December for both years and dips in February 2022 and September 2023.
  • Top Manufacturers:
    • Most sales volume (EUR) in 2022: Others (41.23%) and Royal Blends Group (34.91%).
    • Fewest sales volume (EUR) in 2023: Elite Sweets (1.96%).
  • Popular Packaging:
    • Bag (43.81%) and unpacked (23.55%) led in sales by weight.
  • Top Candy Categories: Minty Morsel Almonds (€1.20M) and Pistachio Paradise Toffee (€1.17M).
  • Leading Brands:
    • Most chips sold in 2022: Land Corp (€2.9M).
    • Most chocolate-related candies sold in 2023: Silver Snacks (€1.7M).
  • Profitable Distribution Channel: Small and specialty stores accounted for the highest share (20.06%).

ZoomCharts visuals used

Drill Down Pie PRO Drill Down Pie PRO
Drill Down Donut PRO Drill Down Donut PRO

Need help?

Send your question to ZoomCharts assistant, and we will respond to you as soon as possible.

Contact Us

Mobile view allows you to interact with the report. To Download the template please switch to desktop view.

Report Overhaul

ZoomCharts Academy

Learn ZoomCharts with experts and become certified!

Go to Academy!
Report Overhaul

Was this helpful? Thank you for your feedback!

Sorry about that.

How can we improve it?

Candy Market Share Analysis 9

Share

ZoomCharts

Welcome to ZoomCharts

You’re almost there! Create an account to keep your saved reports.

or
Sign up with Microsoft

Verify your email address

We have sent a code to your email address. Please input the code below.

Didn't receive code? Request again (after 30 seconds)

Already have an account? Log in

ZoomCharts

Log in to your ZoomCharts account

Log in with Microsoft
or
Forgot password?

Reset your password

We'll email you instructions on how to reset your password

Don't have an account? Sign up

Please add credits

You have 0 available downloads.
Get more credits or upgrade your plan to continue.

View pricing
logo
[email protected]
+44 204 577 3993
logo

Products

Drill Down Network PRO Drill Down Waterfall PRO Drill Down Graph PRO Drill Down Combo PRO Drill Down Combo Bar PRO Drill Down Donut PRO Drill Down Pie PRO Drill Down TimeSeries PRO Drill Down Timeline PRO Drill Down Map PRO Drill Down Scatter PRO All Visuals

Resources

Report Examples Webinars Blog ZoomCharts Academy Visuals Gallery Documentation Custom Visual Development Subscribe to News

Solutions

Custom Visual Development

Company

Pricing About Us Partners Leave feedback Join PowerGroup EU Funding

Help

ZoomCharts Assistance Contact Sales Contact Support FAQ

Drill Down Network PRO Drill Down Waterfall PRO Drill Down Graph PRO Drill Down Combo PRO Drill Down Combo Bar PRO Drill Down Donut PRO Drill Down Pie PRO Drill Down TimeSeries PRO Drill Down Timeline PRO Drill Down Map PRO Drill Down Scatter PRO All Visuals

Report Examples Webinars Blog ZoomCharts Academy Visuals Gallery Documentation Custom Visual Development Subscribe to News

Custom Visual Development

Pricing About Us Partners Leave feedback Join PowerGroup EU Funding

ZoomCharts Assistance Contact Sales Contact Support FAQ
+44 204 577 3993
[email protected]

Ready to get in touch?

Contact our experts with any question about Power BI and ZoomCharts for Free!

Contact us

© 2025, Data Visualization Software Lab

U.S. Patents No. 11,645,343; 11,921,804; 12,346,389

Cookies
Privacy Policy
Global
Legal
Patent
warning

Error message

success

Success info: Done!

ZoomCharts AI Assistant

We noticed you're using an old OS version.

For the best experience, we recommend upgrading to ensure that all website features display correctly.

Cookie settings

We use necessary cookies for site functionality, as well as statistic, marketing, and preference cookies to enhance your experience. For more information and to manage your preferences, please visit our Cookie policy