853
Bao Chau Nguyen Tran
Bao Chau Nguyen Tran

Report Author: Chau Nguyen
853
Share template with others
Report submitted for the FP20 Analytics ZoomCharts Challenge, April 2025. The report was built using the Inventory Management Dataset and includes ZoomCharts custom Drill Down PRO visuals for Power BI.
Author's description:
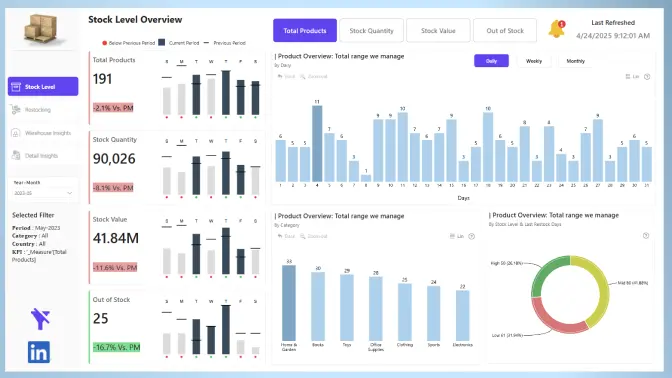
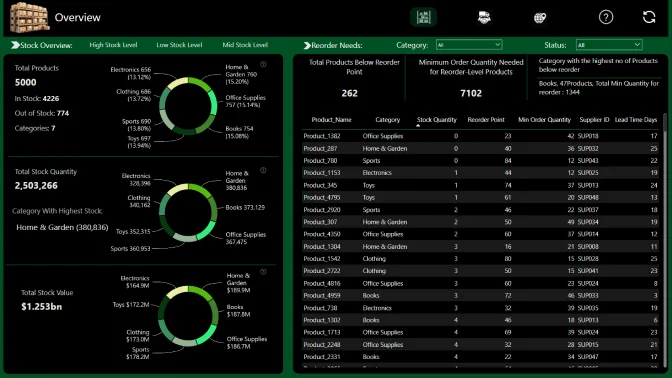
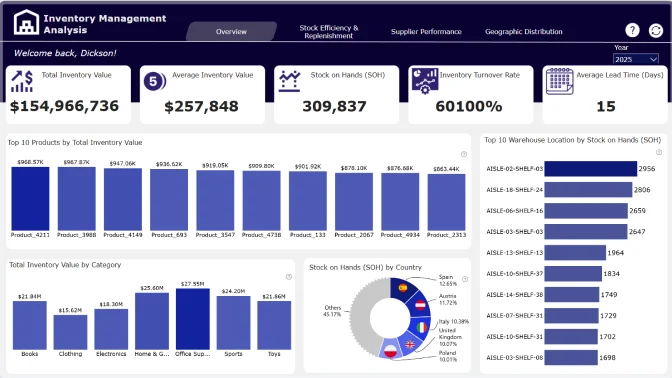
📊 Inventory Management Dashboard (3 Pages)
This interactive dashboard provides a comprehensive view of stock levels, sales trends, restocking behavior, and supplier performance. Designed to support data-informed decision-making, it brings together key metrics and visual insights to help monitor and enhance inventory efficiency across multiple product categories.
🔍 Key Highlights:
• Stock Overview – Real-time visibility into available, reserved, and incoming stock
• Sales Analysis – Discover best-selling products, seasonal trends, and category breakdowns
• Purchase Summary – Review procurement volumes, supplier contributions, and lead times
• Supplier Insights – Evaluate vendor performance based on delivery speed and consistency
• Product Metrics – Track inventory aging and turnover to optimize restocking and minimize waste
💡 Why It Matters
With this report, stakeholders can take a proactive approach to inventory management—reducing stockouts and overstock, streamlining operations, and boosting overall performance and profitability.
ZoomCharts visuals used
4U Report Challenges
Participate in data challenges, build and submit reports to get free template downloads.
Join CommunityMobile view allows you to interact with the report. To Download the template please switch to desktop view.
Was this helpful? Thank you for your feedback!
Sorry about that.
How can we improve it?