751
B2B Sales Performance Dashboard in Power BI
B2B Sales Performance Dashboard in Power BI
More Report pages
Report Author: ZoomCharts
751
Share template with others
Summary
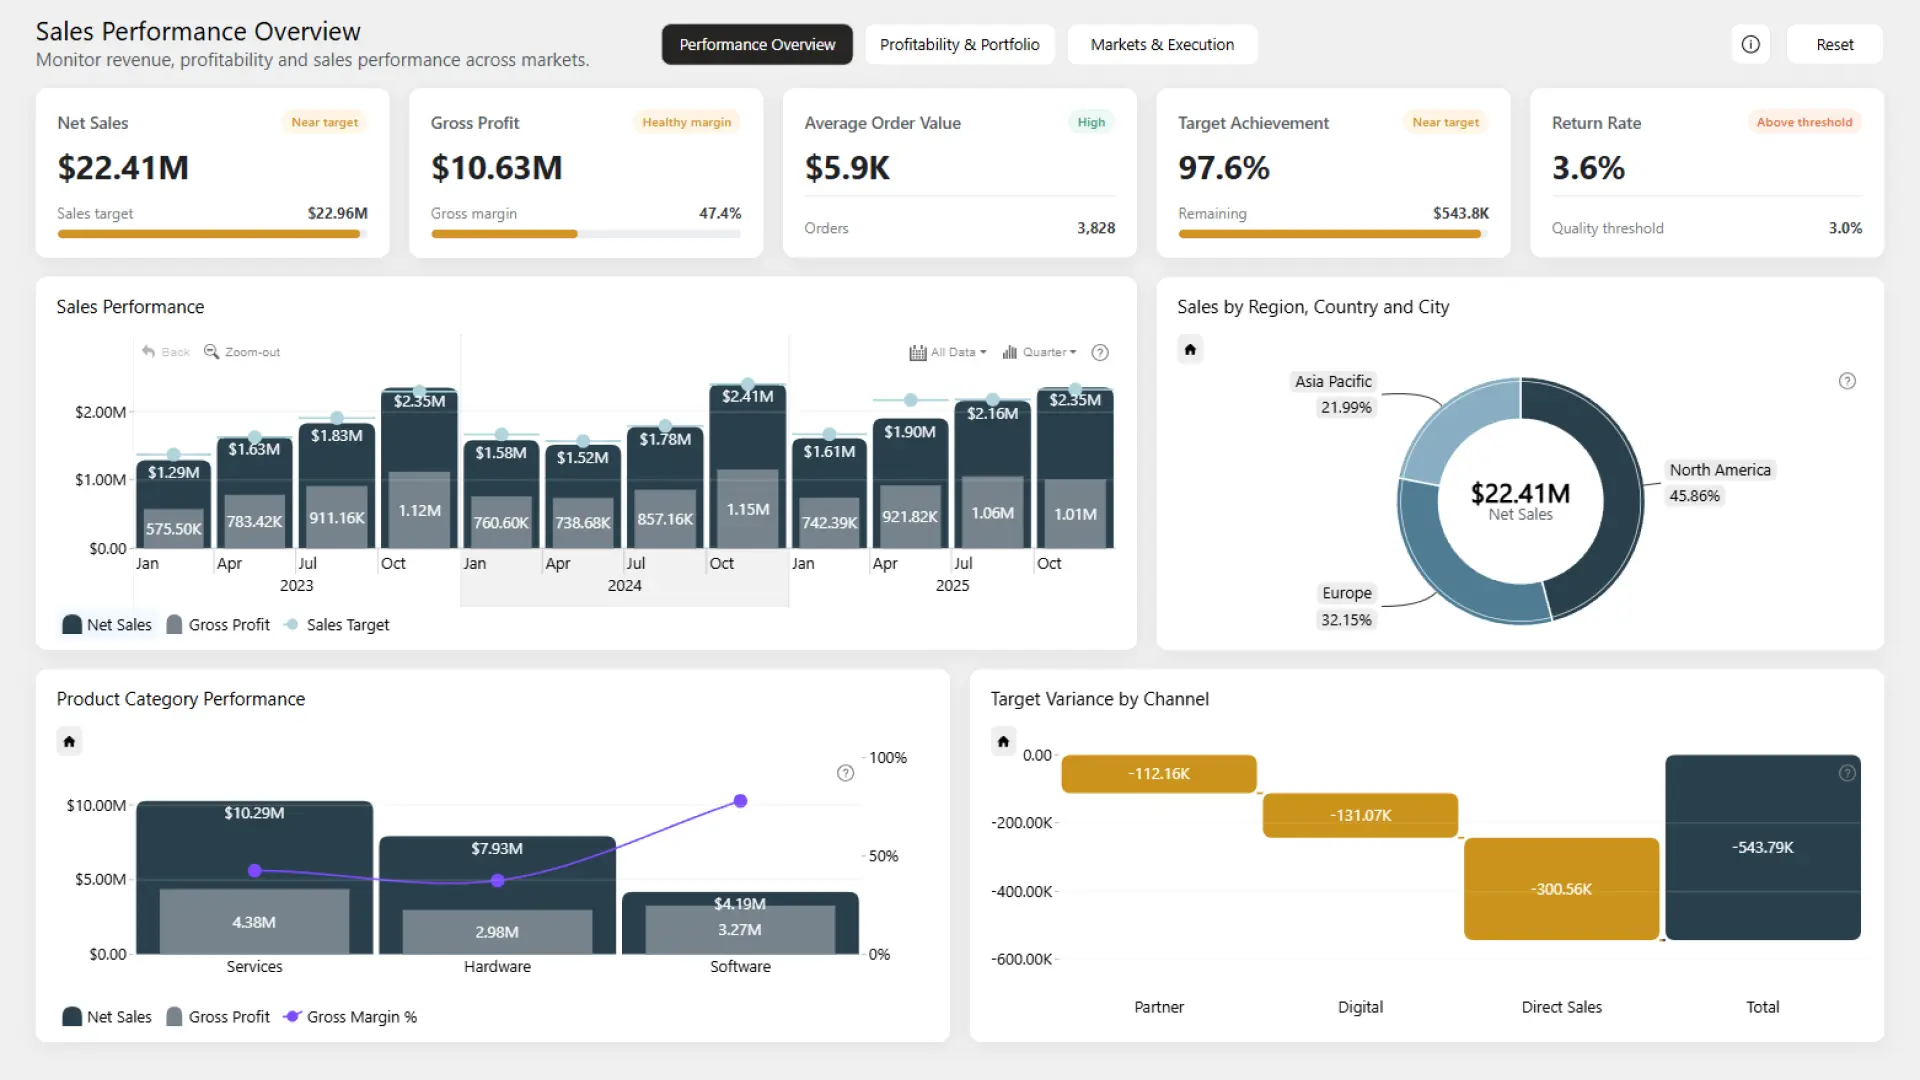
This B2B sales performance dashboard Power BI example provides a clear view of sales results, profitability, and commercial execution.
It helps sales leaders and analysts monitor net sales, gross profit, target achievement, average order value, and return rates across products, markets, channels, customers, and sales teams.
Key Insights of the B2B Sales Performance Dashboard
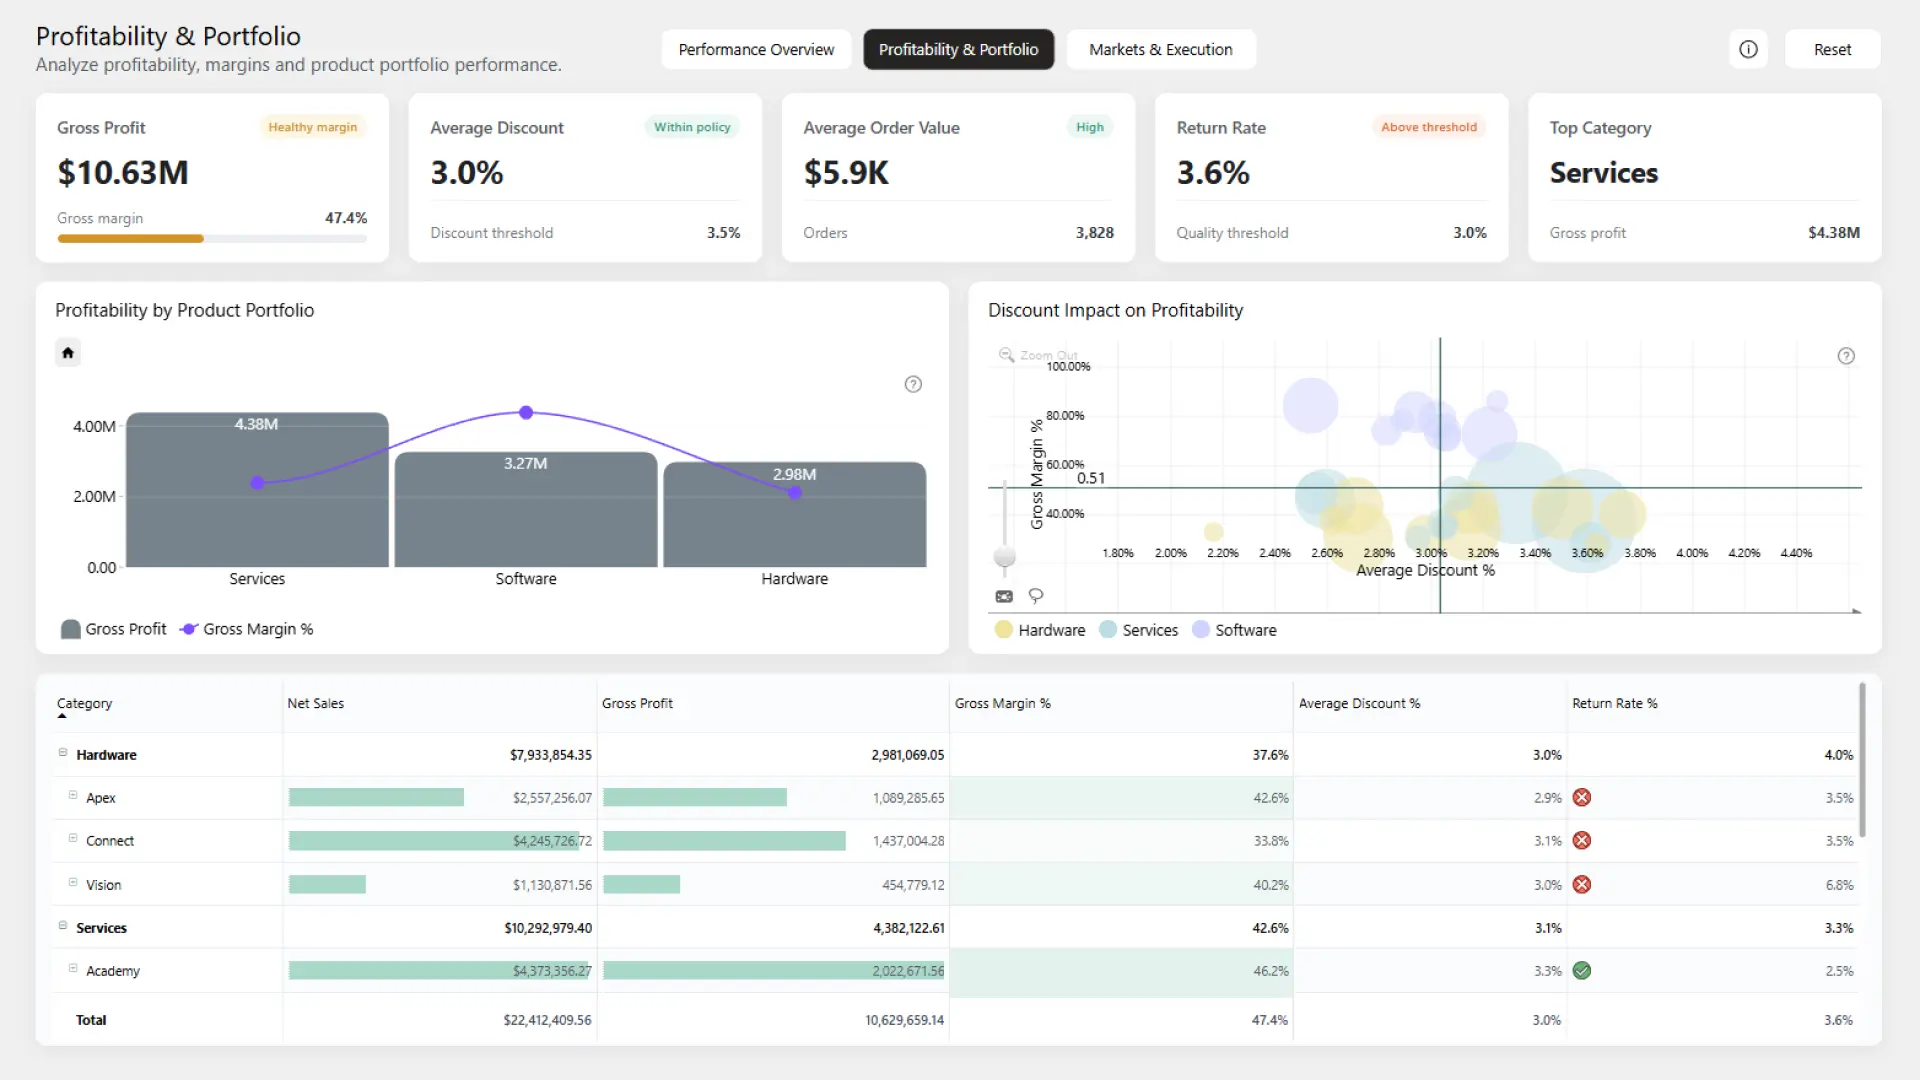
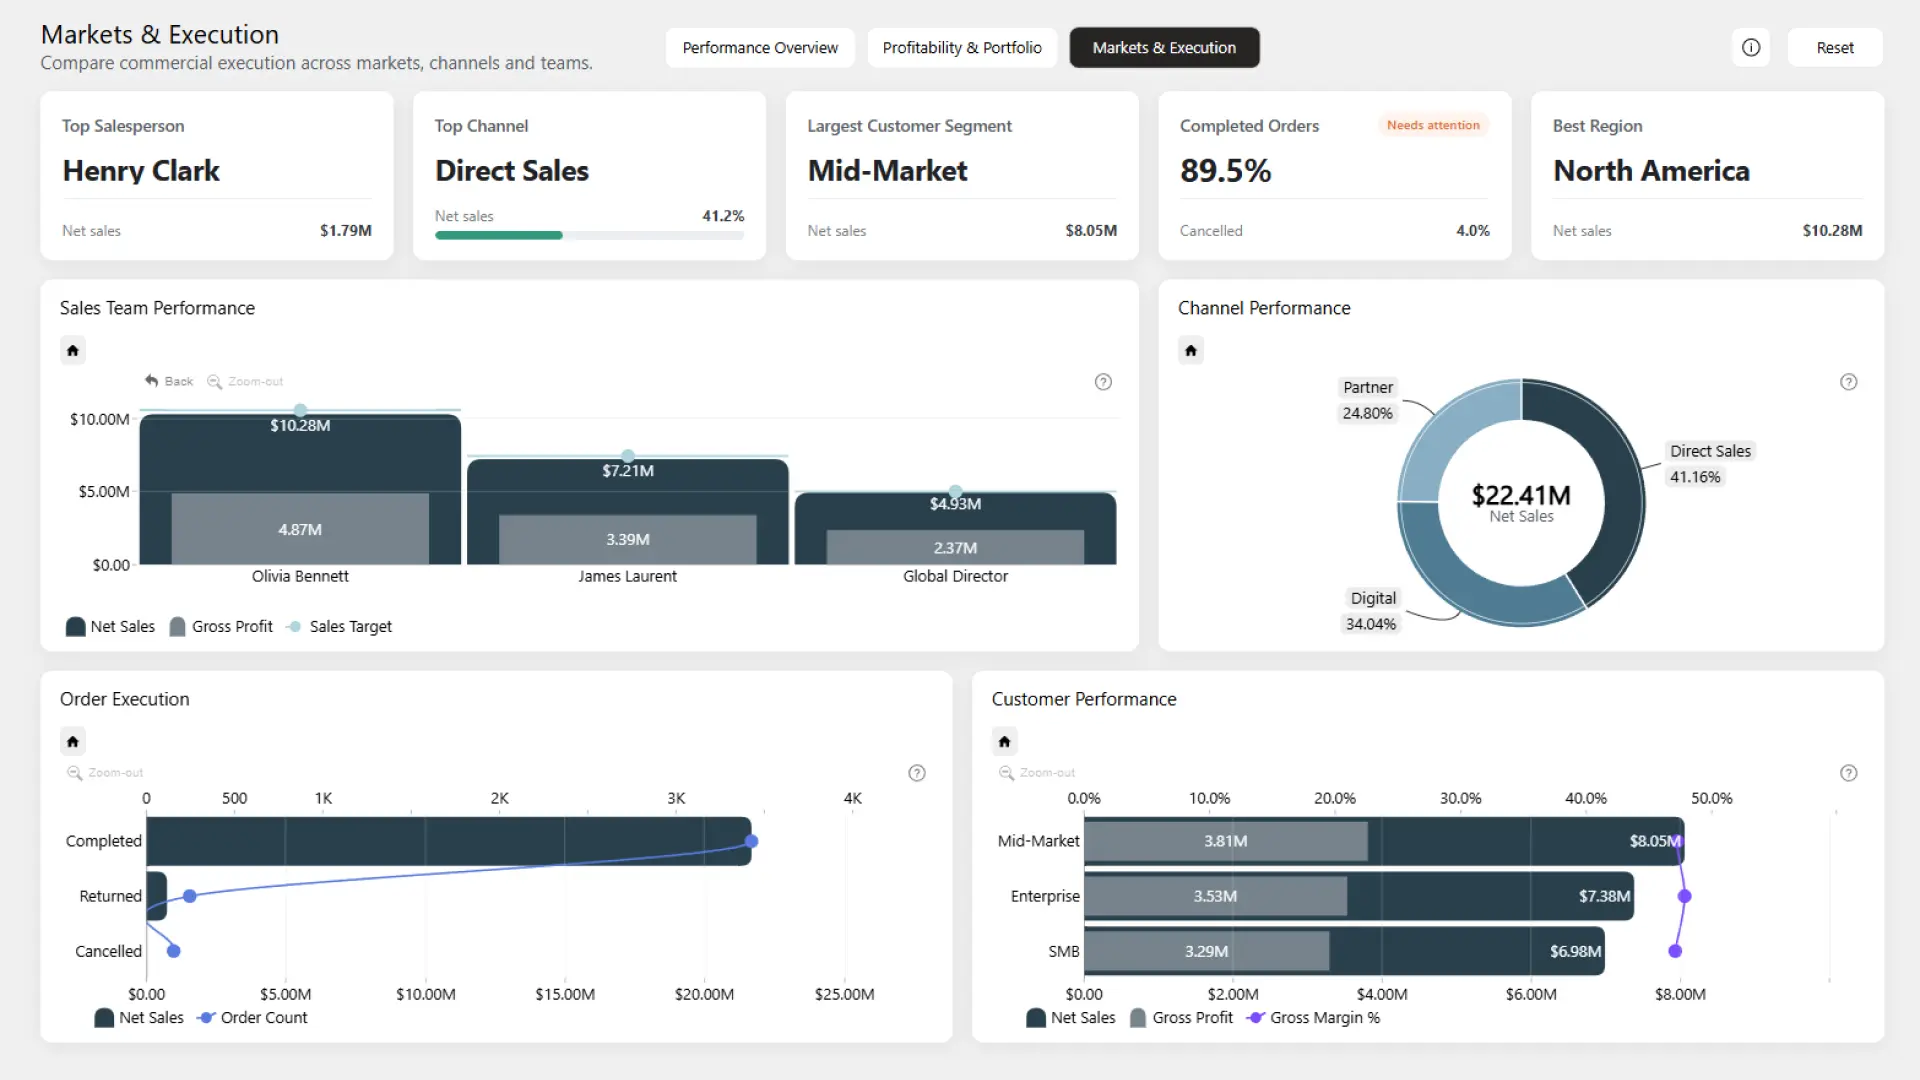
The report is structured in three pages: Performance Overview, Profitability & Portfolio, and Markets & Execution. Each page allows users to move from high-level KPIs to more detailed sales analysis. Key insights include:
- Sales performance: net sales and gross profit over time compared with sales targets
- Regional performance: sales results across regions, countries, and cities
- Product profitability: gross profit, gross margin, discounts, and return rates by category, brand, subcategory, and product
- Target variance: sales performance against targets across channels and market segments
- Customer and channel performance: results by customer, industry, customer segment, channel group, channel, and sales motion
- Sales execution: sales team performance and completed orders by status, priority, and payment method
Interactive Power BI visuals make it easy to filter related charts, select data points, and drill down into detailed categories. Page navigation and reset controls help users explore different perspectives and quickly return to the default report view.
How to Use This B2B Sales Performance Dashboard
Navigate between the three report pages to review overall performance, examine product profitability, and compare execution across markets, customers, channels, and sales teams.
Click active chart elements to apply cross-chart filters, use Ctrl + click to select multiple values, or drill down through supported hierarchies such as date, geography, product, channel, and sales organization. Use the reset control to clear applied filters.
Download the .pbix file to review the report structure, measures, visual settings, and calculations, or adapt the dashboard to your own B2B sales data.


4U Report Challenges
Participate in data challenges, build and submit reports to get free template downloads.
Join CommunityMobile view allows you to interact with the report. To Download the template please switch to desktop view.
How to use a PBIX template
Preview the interactive report, download the PBIX file, open it in Power BI Desktop, and replace the same data connection with your own dataset.
Preview and download
Explore the report online and download the PBIX template file.
Open in Power BI Desktop
Open the downloaded PBIX file in Power BI Desktop.
Connect your data
Replace the sample data source with your own dataset.
Refresh and adjust
Refresh the model and update fields or visual were needed.
Save and share
Save your report and publish it for your audience.


