413
Airlines Delay Analysis 4
Airlines Delay Analysis 4
Report Author: Phung Le
413
Share template with others
Report submitted for the FP20 Analytics ZoomCharts Challenge, January 2025. The report was built using the Airline Delays Dataset and includes ZoomCharts custom Drill Down PRO visuals for Power BI.
Author's description:
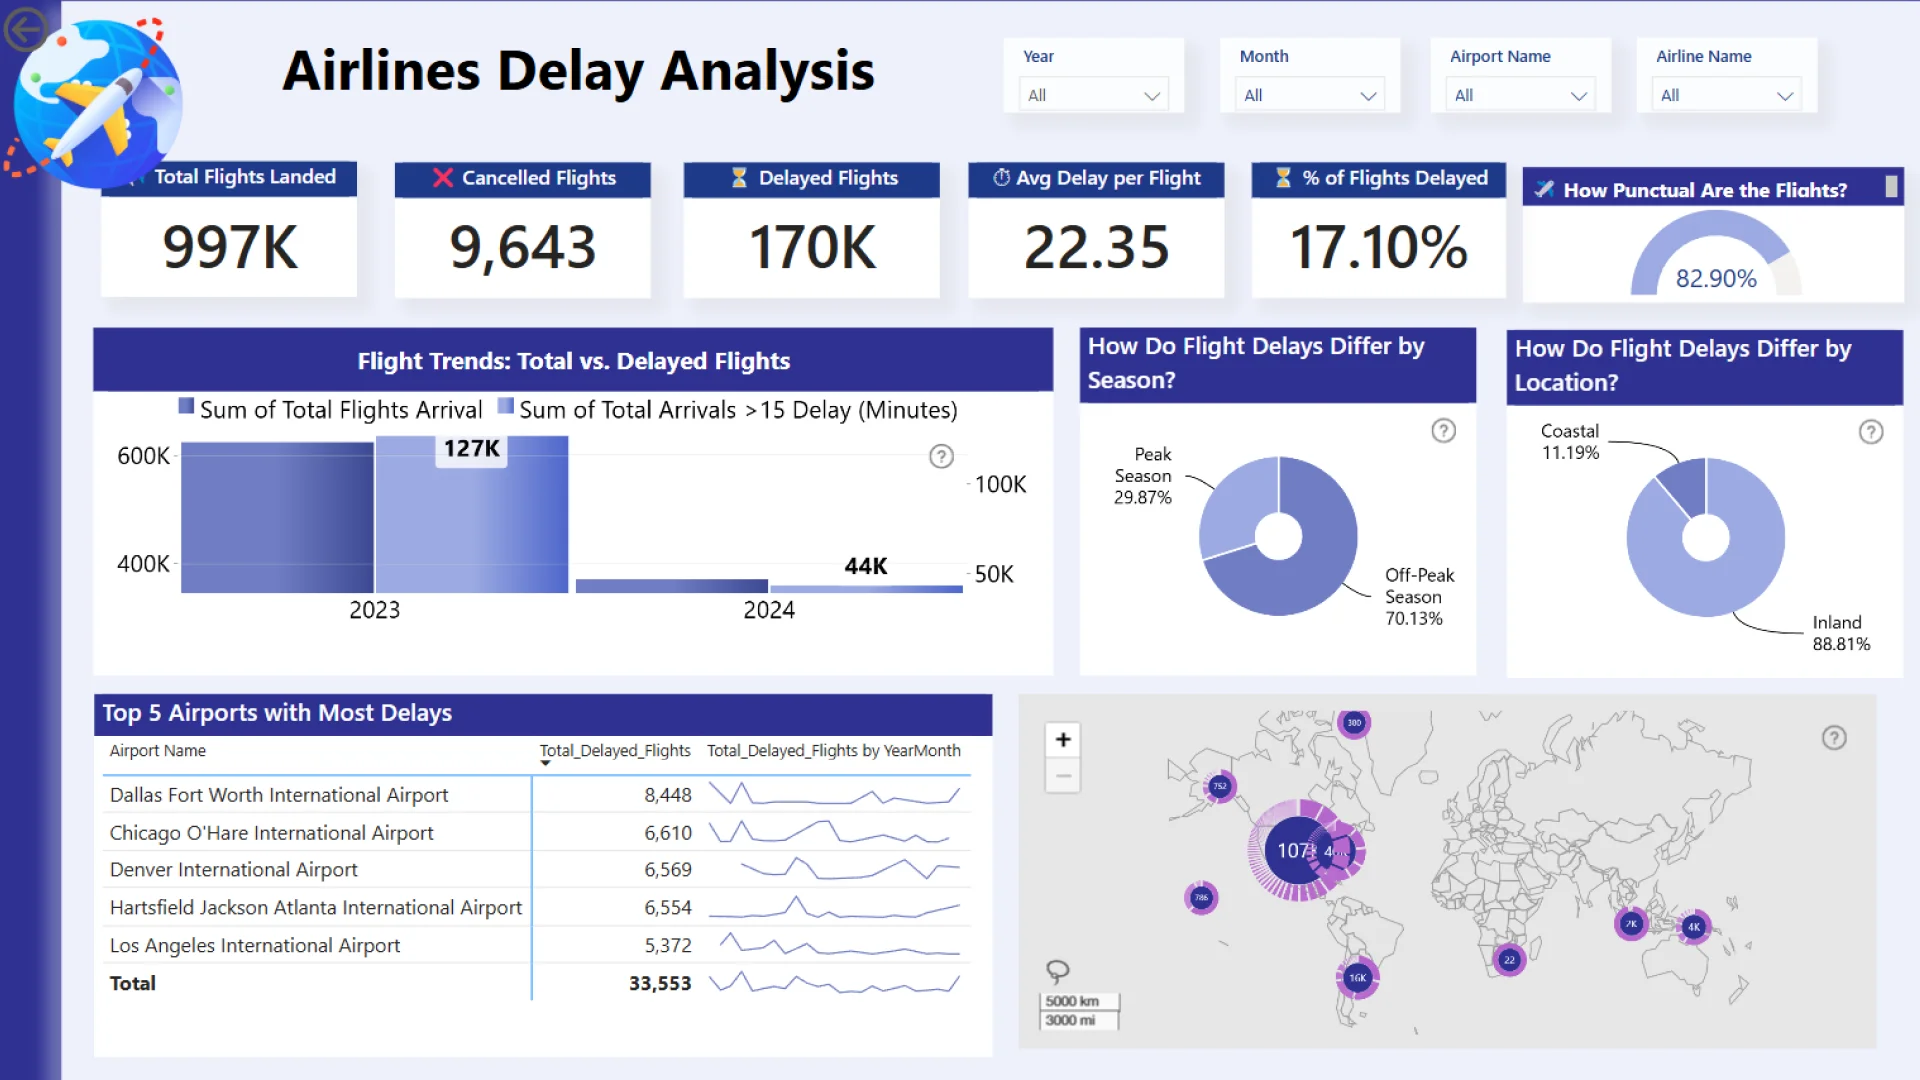
✈️ Airlines Delay Analysis Dashboard
This dashboard provides a comprehensive overview of flight delays, helping stakeholders uncover key trends and insights.
🔹 Page 1: Overview
📌 High-level flight performance insights, including:
-
Key KPIs: Total Flights, Cancellations, Delays, Average Delay Time, % of Delayed Flights.
-
Seasonal & Geographical Breakdown: Peak vs. Off-Peak seasons, Inland vs. Coastal airports.
-
Top 5 Airports with Most Delays + Geo Heatmap for spatial analysis.
🔹 Page 2: Detailed View
📌 In-depth analysis of delay causes and impacts:
-
Delay Causes Breakdown: Weather, Carrier Issues, Late Aircraft, NAS.
-
Severe Delay Impact: Flights delayed >60 minutes.
-
Top 5 Affected Airlines & Airports by total delay occurrences.
-
Monthly Delay Trends & Weather-Related Delays Heatmap for geographic insights.
📊 Data-Driven Decision-Making
This dashboard empowers airport management, airlines, and policymakers by identifying:
✅ Delay trends & peak congestion periods.
✅ Operational inefficiencies & key pain points.
✅ Actionable insights to improve flight performance.
🚀 Ready to explore the insights?
ZoomCharts visuals used
Need help?
Send your question to ZoomCharts assistant, and we will respond to you as soon as possible.
Contact UsMobile view allows you to interact with the report. To Download the template please switch to desktop view.
Was this helpful? Thank you for your feedback!
Sorry about that.
How can we improve it?