684
Airline Delay Analysis 3
Airline Delay Analysis 3
Report Author: Ubong Idongesit
684
Share template with others
Report submitted for the FP20 Analytics ZoomCharts Challenge, January 2025. The report was built using the Airline Delays Dataset and includes ZoomCharts custom Drill Down PRO visuals for Power BI.
Author's description:
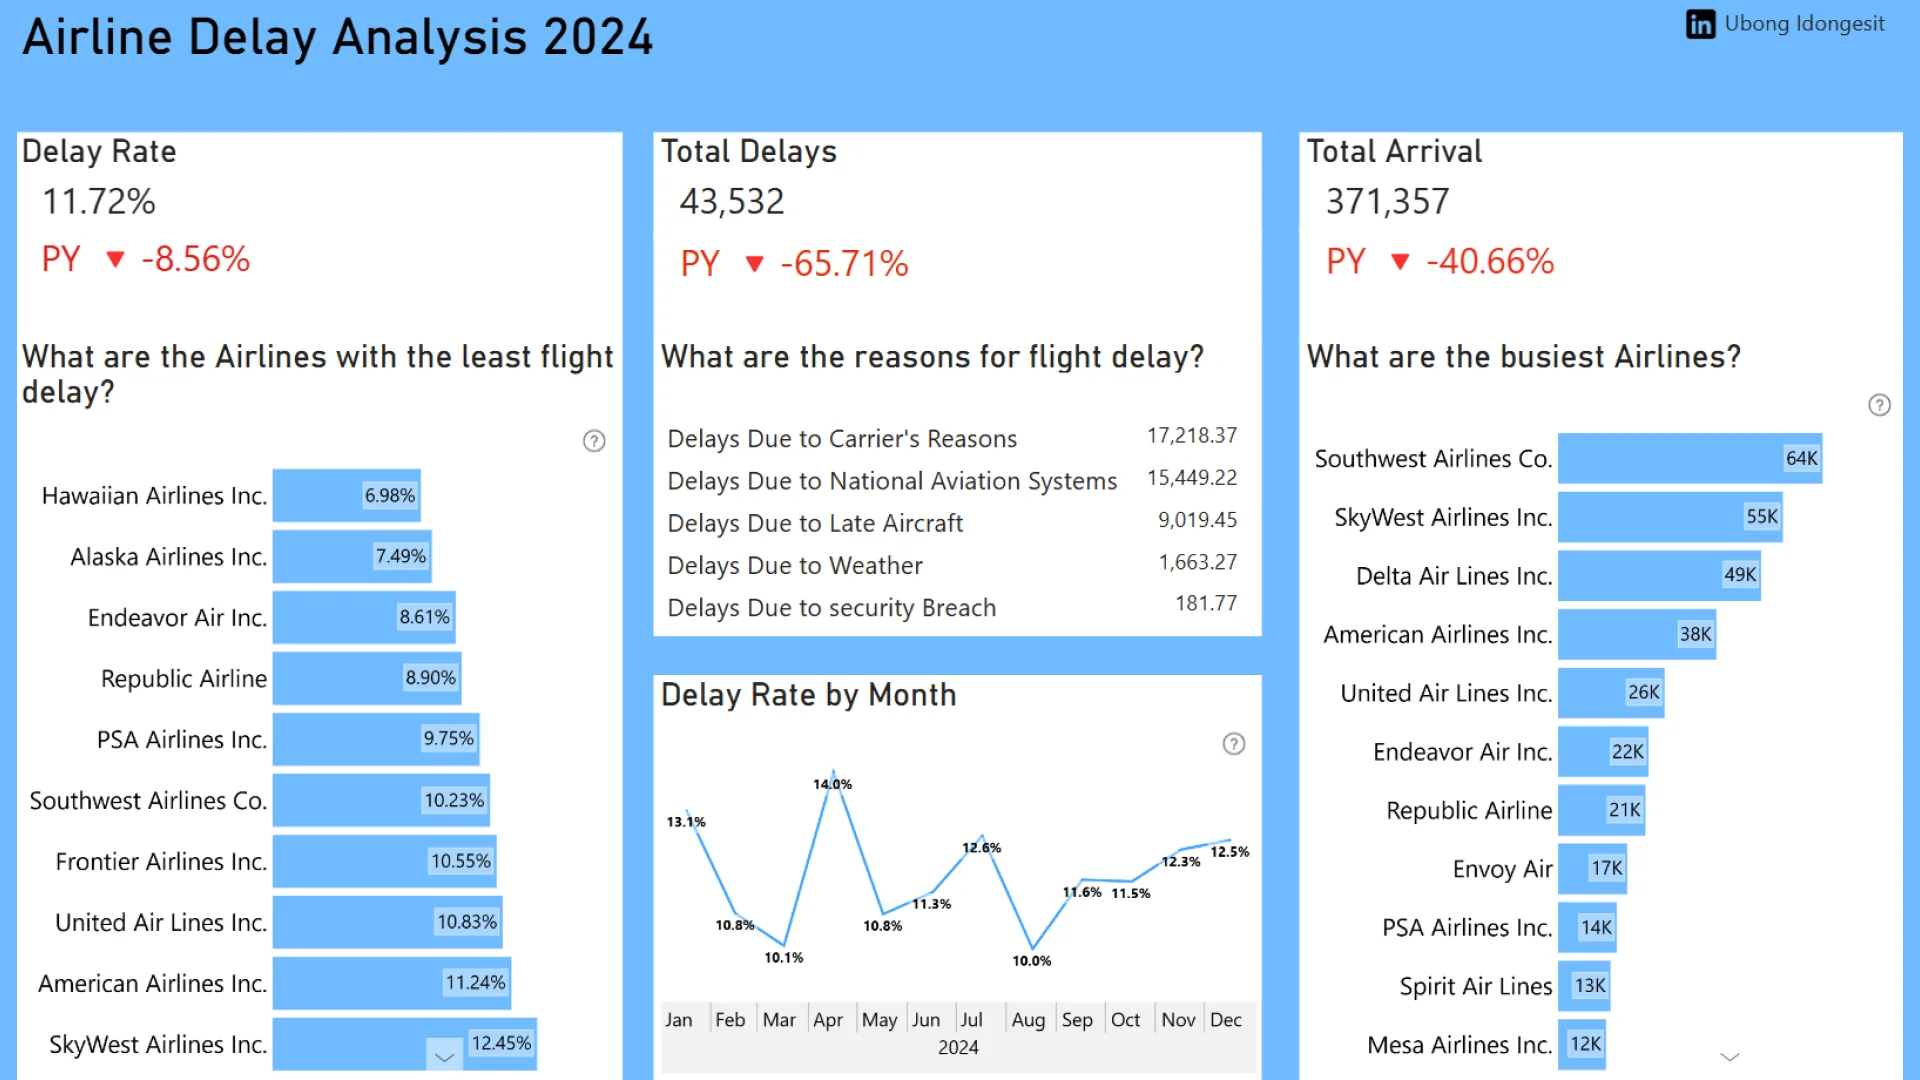
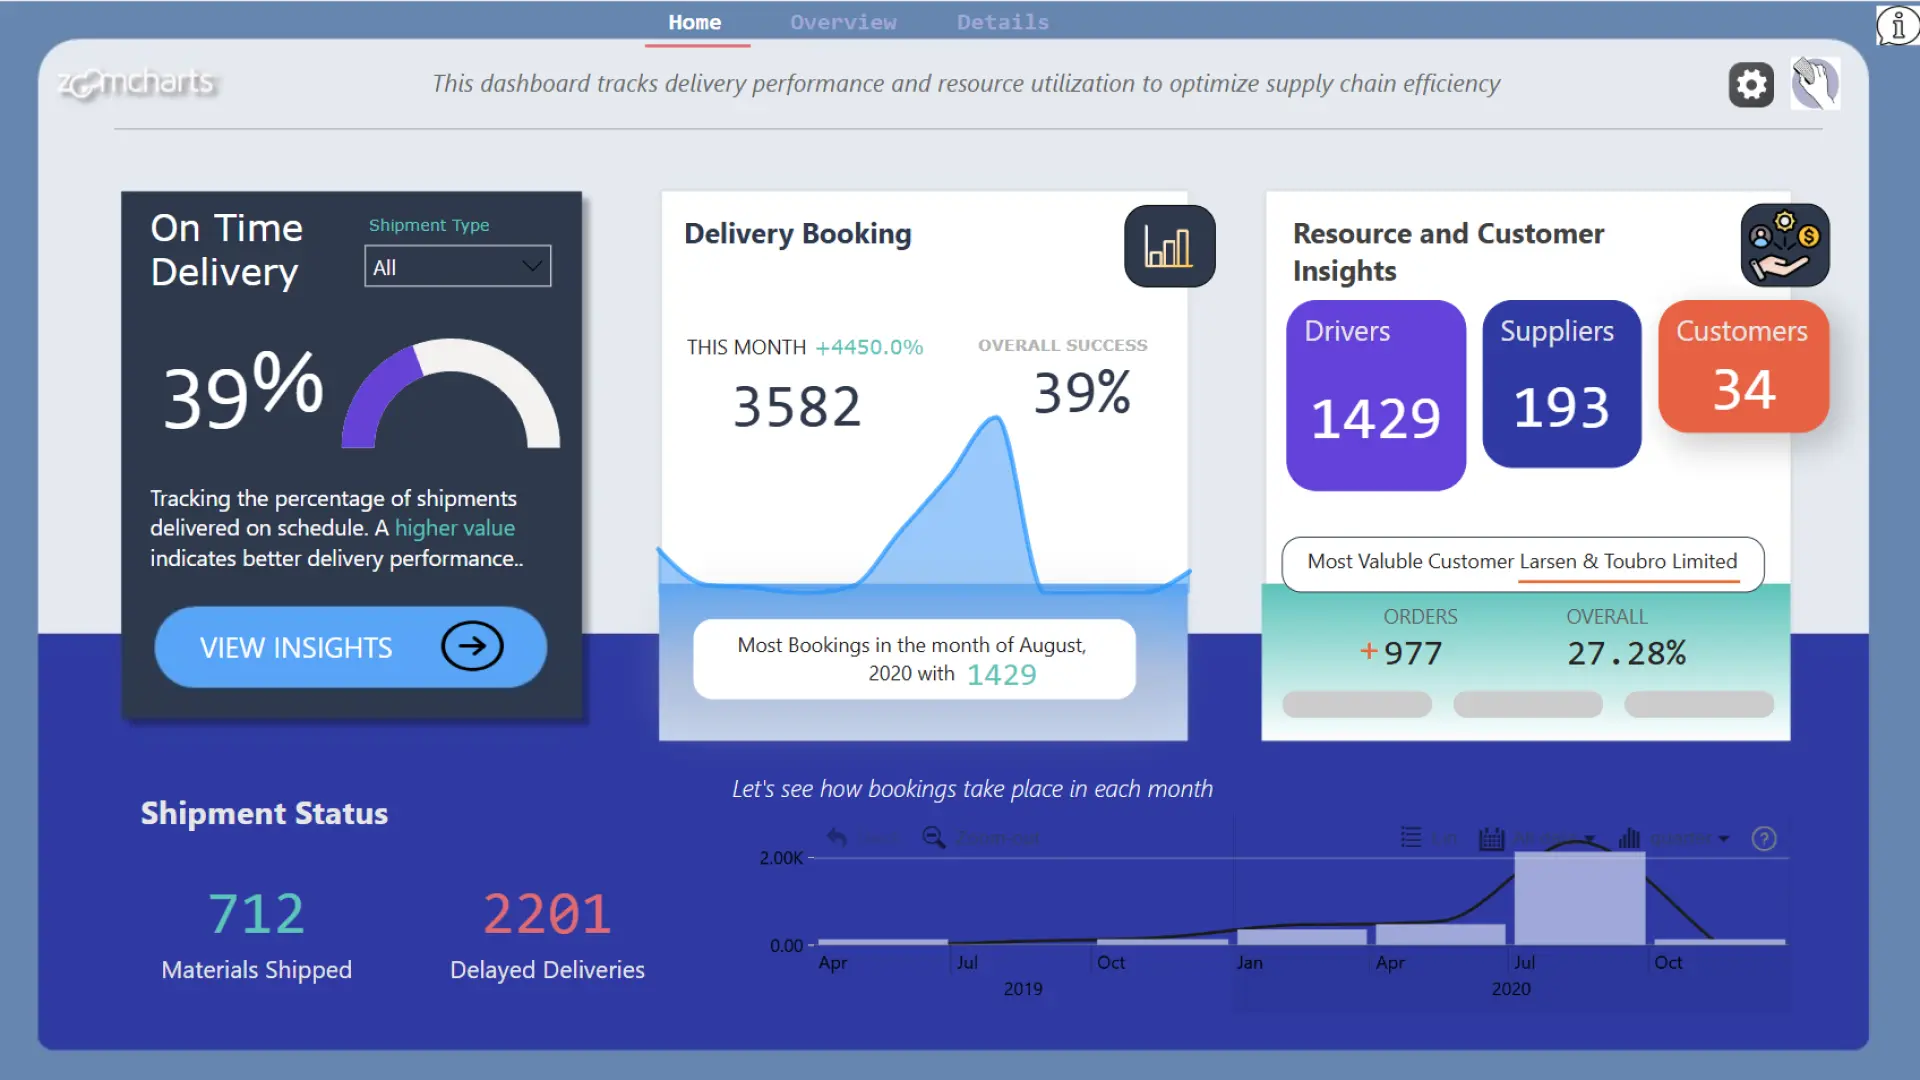
This interactive dashboard offers insights into airline punctuality, major delay factors, and industry trends to support operational improvements. This analysis will help to understand the performance of airlines, identifying areas for improvement, and enhance customer satisfaction by minimizing flight delays.
4U Report Challenges
Participate in data challenges, build and submit reports to get free template downloads.
Join CommunityMobile view allows you to interact with the report. To Download the template please switch to desktop view.
Was this helpful? Thank you for your feedback!
Sorry about that.
How can we improve it?