Registration Open
Registration Open
01 July | 11:00
-
Reset your password
We'll email you instructions on how to reset your password
Join the July Data Challenge on HR Workforce Planning & Attrition Analytics. Build a high-demand Power BI use case for your portfolio, sharpen your analytics skills and showcase your work to the community.
Submission deadline
DAYS
HOURS
MINUTES
SECONDS
Register Now
Already have an account? Sign in!


Activate free ZoomCharts license
Get ZoomCharts Developer License Select this option if you already have a Microsoft work or school account to activate and use ZoomCharts visuals in Power BI Desktop.
Activate your free developer license to use Drill Down visuals in your challenge report.
Create a free
Microsoft account
To install ZoomCharts visuals from the Power BI marketplace, you need a Microsoft account.
Don’t have a Microsoft account yet? Create a free account to build reports and join challenges.
Challenge Dataset
Ready to submit?
Submitted:
Your report will undergo validation. Once the validation of your report is complete, we will send you a Power BI Publish to Web link that you can share publicly.
Confirmed your submission fits the criteria:
Reviewed:
Rejection reason:
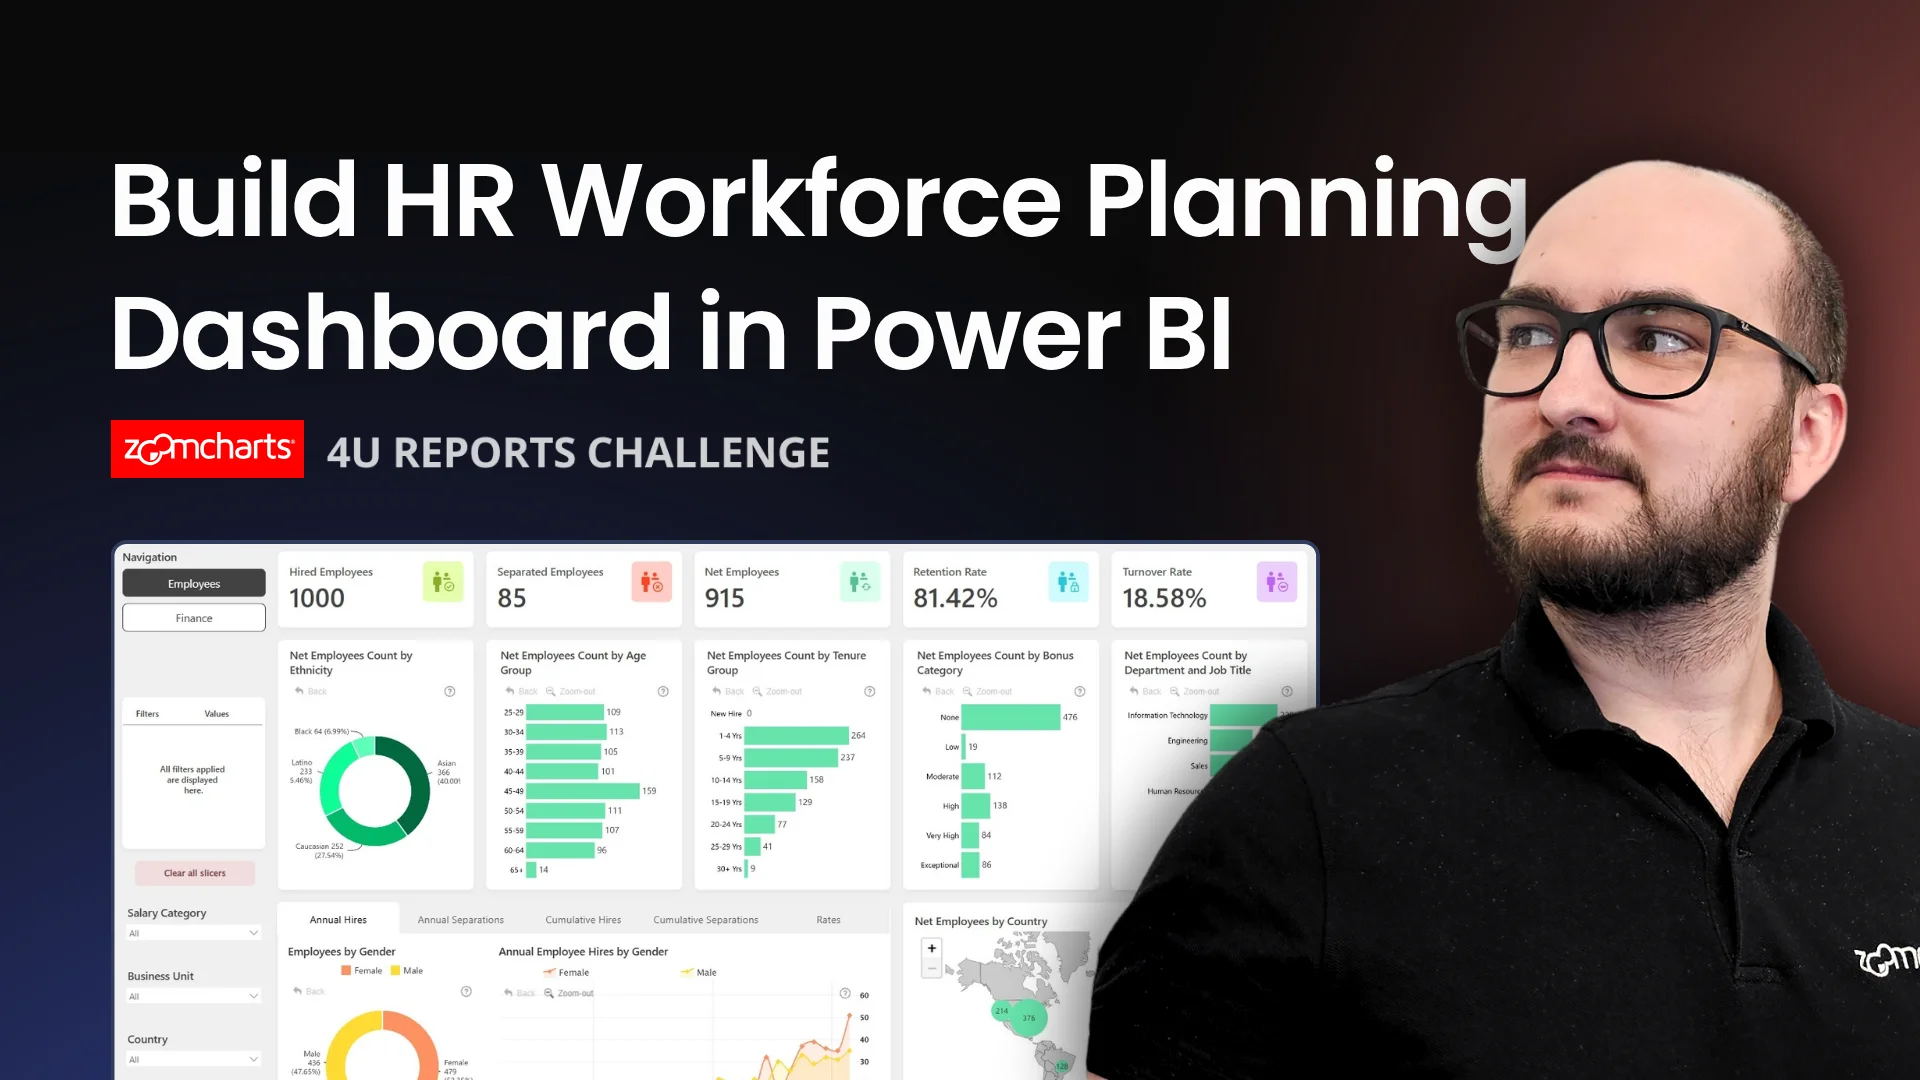
Workshop | How to Build HR Workforce Planning Dashboard in Power BI
Workshop | How to Build HR Workforce Planning Dashboard in Power BI
09 July | 07:00
-
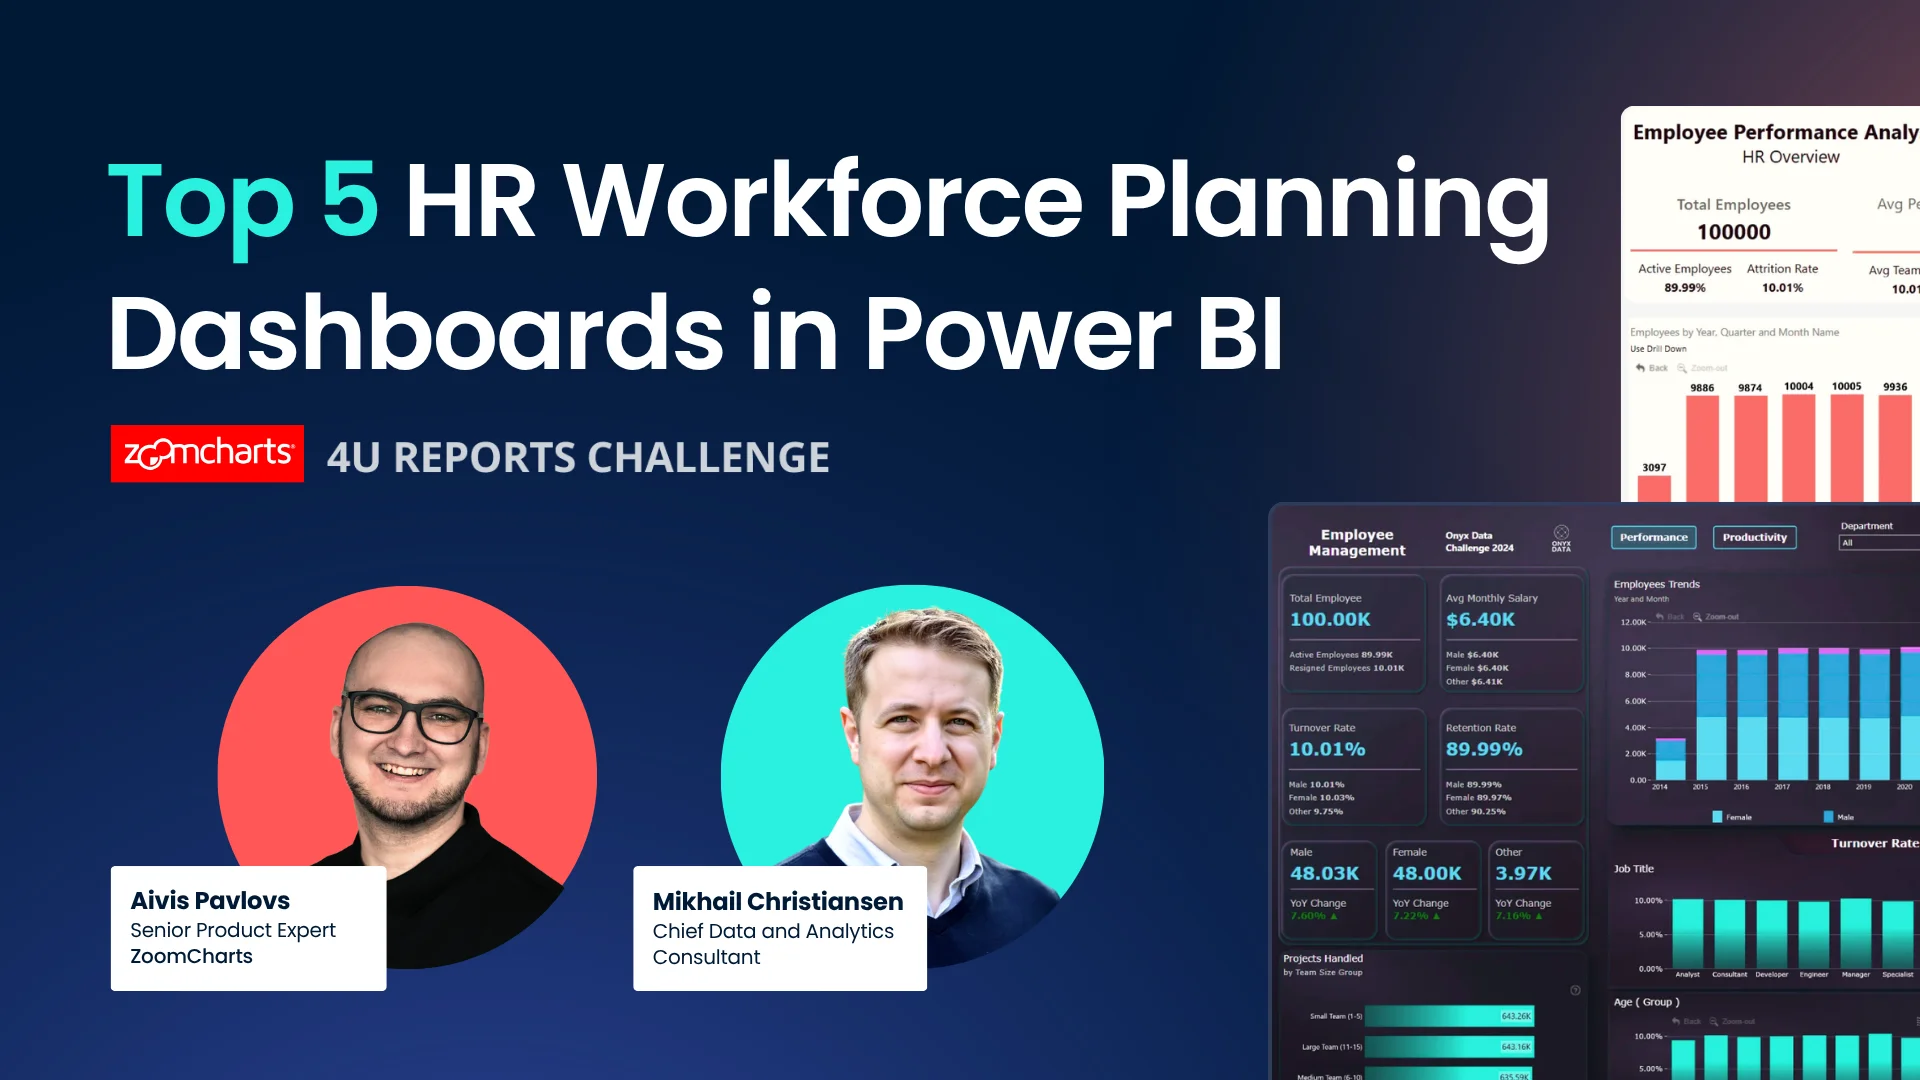
Webinar | Top 5 HR Workforce Planning Dashboards in Power BI
Webinar | Top 5 HR Workforce Planning Dashboards in Power BI
30 July | 07:00
01 July - 26 July
Improve your Power BI data visualization skills and demonstrate strong professional credibility by building 4U Reports.
In this challenge, you’ll be provided with a business case dataset to analyze and visualize in Power BI. Each month, a new dataset is released, allowing you to build high-demand Power BI reports and dashboards for your portfolio, gain recognition within a community of 20k+ BI professionals, and win amazing prizes from ZoomCharts.
🏆 The best 3 overall reports will receive a $300 / $200 / $100 Amazon gift card.
Being selected in the Top 5 will grant you +10 free downloads from the Power BI Report Gallery.
On July 30, the top 5 reports and prize winners will be announced during the Live Webinar.

Chief Data and Analytics Consultant
CEO and Founder at Swift Insights
Learn more about ZoomCharts visuals & gain a knowledge advantage in the contest by joining the upcoming webinars! You'll also get the chance to your ask questions and get expert answers in the Q&A section.
Follow these steps to register, build your Power BI report, submit your entry, and compete for prizes.
Upload your report in .pbix format using the submission form on this page.
If your report does not meet the challenge requirements:
You will receive an email explaining what needs to be fixed. You can update your report and submit it again.
Validation timeline:
Note: You can resubmit your entry as many times as needed before the final deadline.
The ZoomCharts team reviews and analyzes the Top 5 Mini Challenge entries during the live webinar. You will learn best practices, improvement tips, and see how others solved the challenge. Winners will be announced during the live webinar and afterward on the ZoomCharts LinkedIn page.
ZoomCharts 4U Report Challenge July 2026
Challenge Brief
Tool
Power BI
Recommended length
Up to 3 pages
Including drill-through pages
Canvas size
16:9 or 1920 x 1080
Build an interactive Power BI report that helps HR and business leaders understand workforce growth, attrition, headcount planning, and employee retention risks.
In this ZoomCharts Power BI Challenge, participants will work with an HR workforce planning dataset covering employee profiles, monthly headcount snapshots, hiring and termination events, compensation, performance reviews, engagement surveys, absences, recruitment activity, and workforce targets.
The goal is to design a clear, decision-ready HR analytics report that helps stakeholders compare the current workforce against planned targets, identify attrition patterns, and understand where people-related risks may affect future workforce planning.
Challenge starts
July 1, 2026
Submission deadline
July 26, 2026
Winners announcement
July 30, 2026
Workforce growth
How has headcount and FTE changed over time?
Attrition risk
Which departments, locations, roles, or employee segments show the highest attrition?
Termination reasons
What are the main termination reasons, and how do voluntary and involuntary exits differ?
Retention drivers
How do engagement, performance, absence, tenure, and compensation patterns relate to retention?
Workforce targets
Where are actual workforce levels above or below planned headcount, FTE, or salary targets?
Recruitment support
How effectively is recruitment supporting workforce needs?
Combine strong HR storytelling with interactive Power BI report design. Use ZoomCharts Drill Down visuals to make it easy to explore workforce trends, compare departments and employee segments, and move from high-level HR KPIs into detailed attrition and planning insights.
Each submission is evaluated based on four main criteria: Inspiring, Intuitive, Interactive, and Insightful. These dimensions ensure that the solution is visually compelling, easy to understand, engaging to use, and capable of delivering valuable insights.
How visually clear, modern, and purposeful the report looks.
How clear and easy it is to understand the report at a glance.
How engaging and seamless the report exploration and interaction with data feels.
How accurate, complete, and meaningful the data is in driving decisions.
Workshop | How to Build HR Workforce Planning Dashboard in Power BI
Workshop | How to Build HR Workforce Planning Dashboard in Power BI
09 July | 07:00
-
Webinar | Top 5 HR Workforce Planning Dashboards in Power BI
Webinar | Top 5 HR Workforce Planning Dashboards in Power BI
30 July | 07:00
01 July - 26 July
You can book a personal session with Senior Product Expert at ZoomCharts, Aivis Pavlovs, to gain practical knowledge about Drill Down Visuals and how they can be used to enhance data storytelling in a report.
Book a meeting