Feel free to leave your vote:
1
Share template with others
Summary
This Power BI report uses the Credit Bank Risk Dataset and features ZoomCharts Drill Down PRO custom visuals for Power BI. It was submitted to the Onyx Data DataDNA ZoomCharts Mini Challenge in September 2025.
Author's Description:
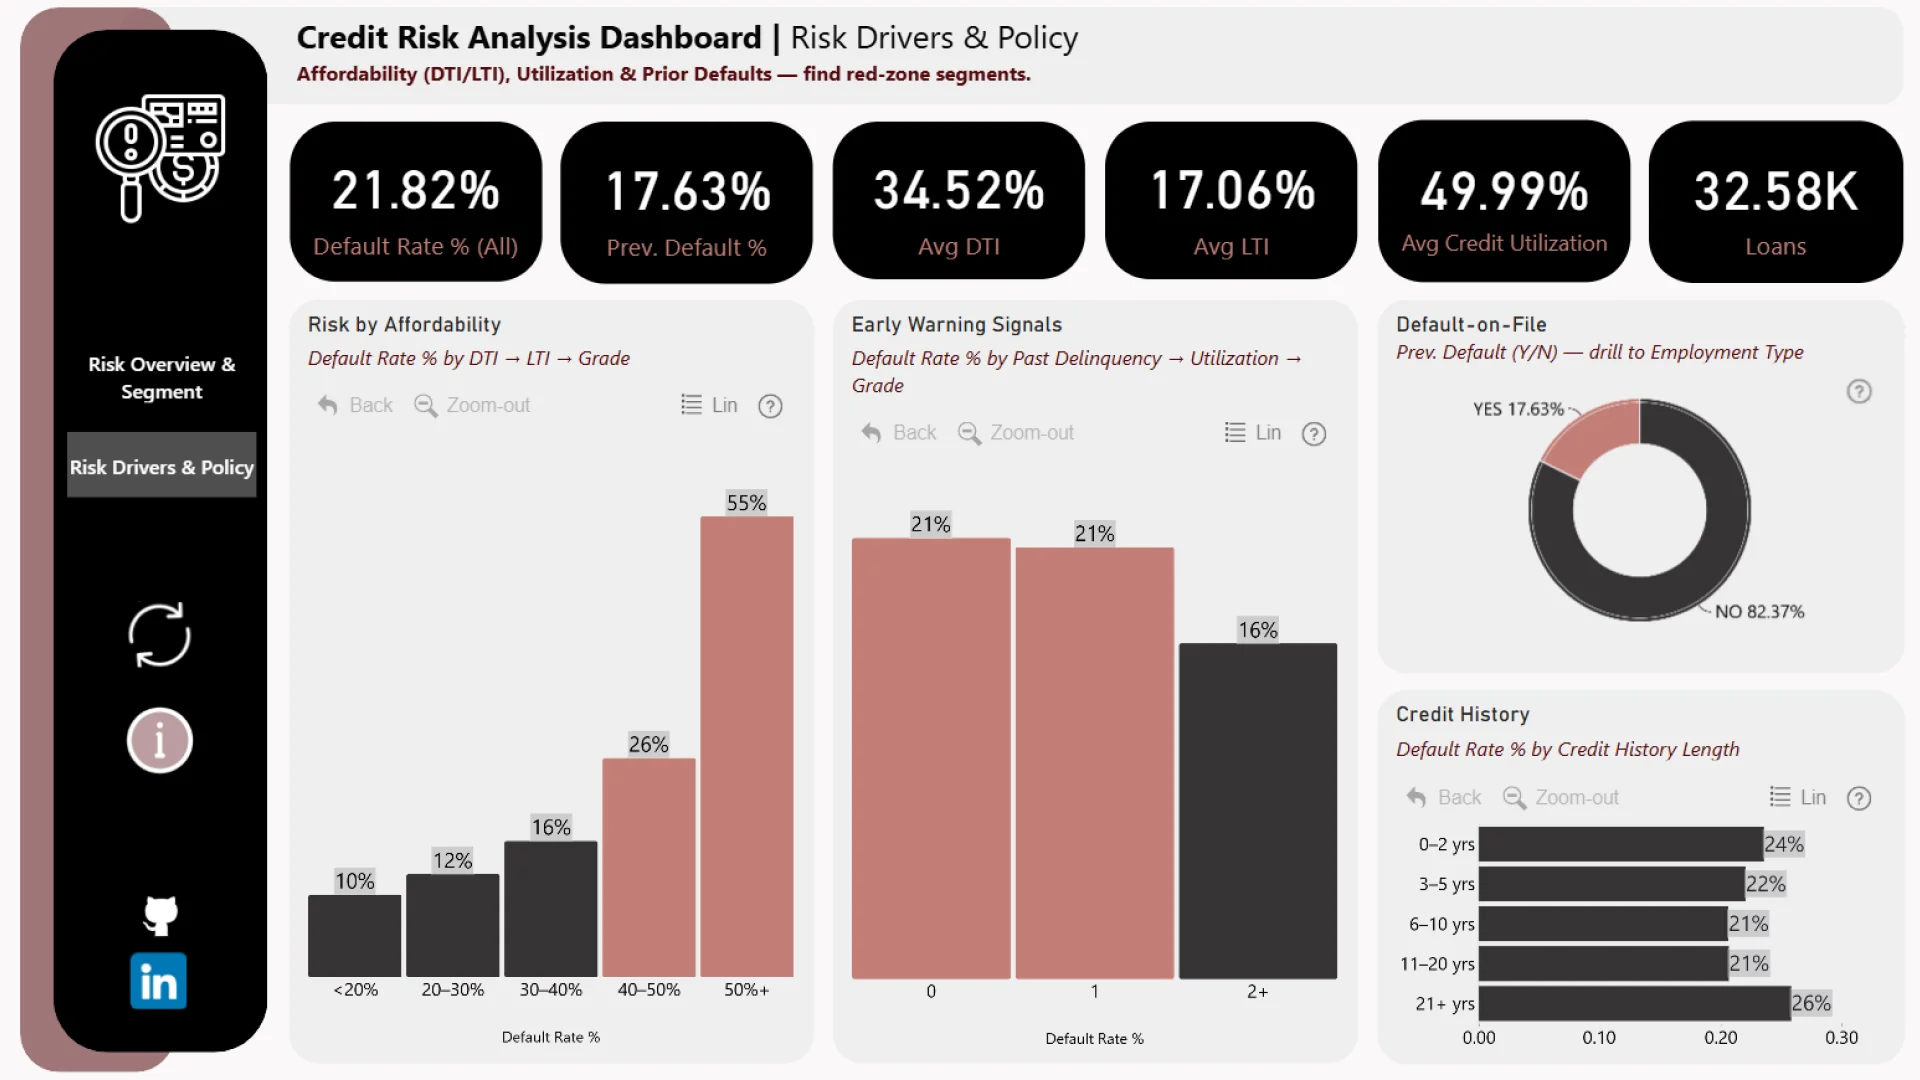
I developed an interactive Credit Risk Analysis Dashboard to uncover who borrows, under what terms, and where risk is concentrated—from portfolio mix to root causes. Key insights include: a baseline default rate of ~21.8%, with Grades D/E and loan intents like Debt Consolidation and Medical showing higher risk; sharp default increases at DTI ≥50% and high LTI, with utilization above 80% as a strong warning signal; and a prior-default segment (~18% of loans) showing ~38% default, alongside a U-shaped credit history effect (highest risk at 0–2 years and 21+ years). Users can explore these patterns through drill-downs (Grade → Intent → Term, DTI → LTI → Grade), a multi-level donut (Intent → Employment → Home Ownership), and geographic risk mapping to identify hotspots.
Mobile view allows you to interact with the report. To Download the template please switch to desktop view.