Feel free to leave your vote:
0
Share template with others
Summary
This interactive Power BI report presents an executive KPI dashboard built with ZoomCharts Drill Down custom visuals for Power BI. It highlights key metrics such as Revenue, EBITDA, Margin, Headcount, and Customer Growth, with Actual vs Budget vs Forecast comparisons, organizational drill-down, and regional performance analysis to support strategic decision-making.
The report was submitted to the ZoomCharts “4U Reports Challenge” (April 2026), using ZoomCharts Drill Down custom visuals for Power BI.
Author's Description:
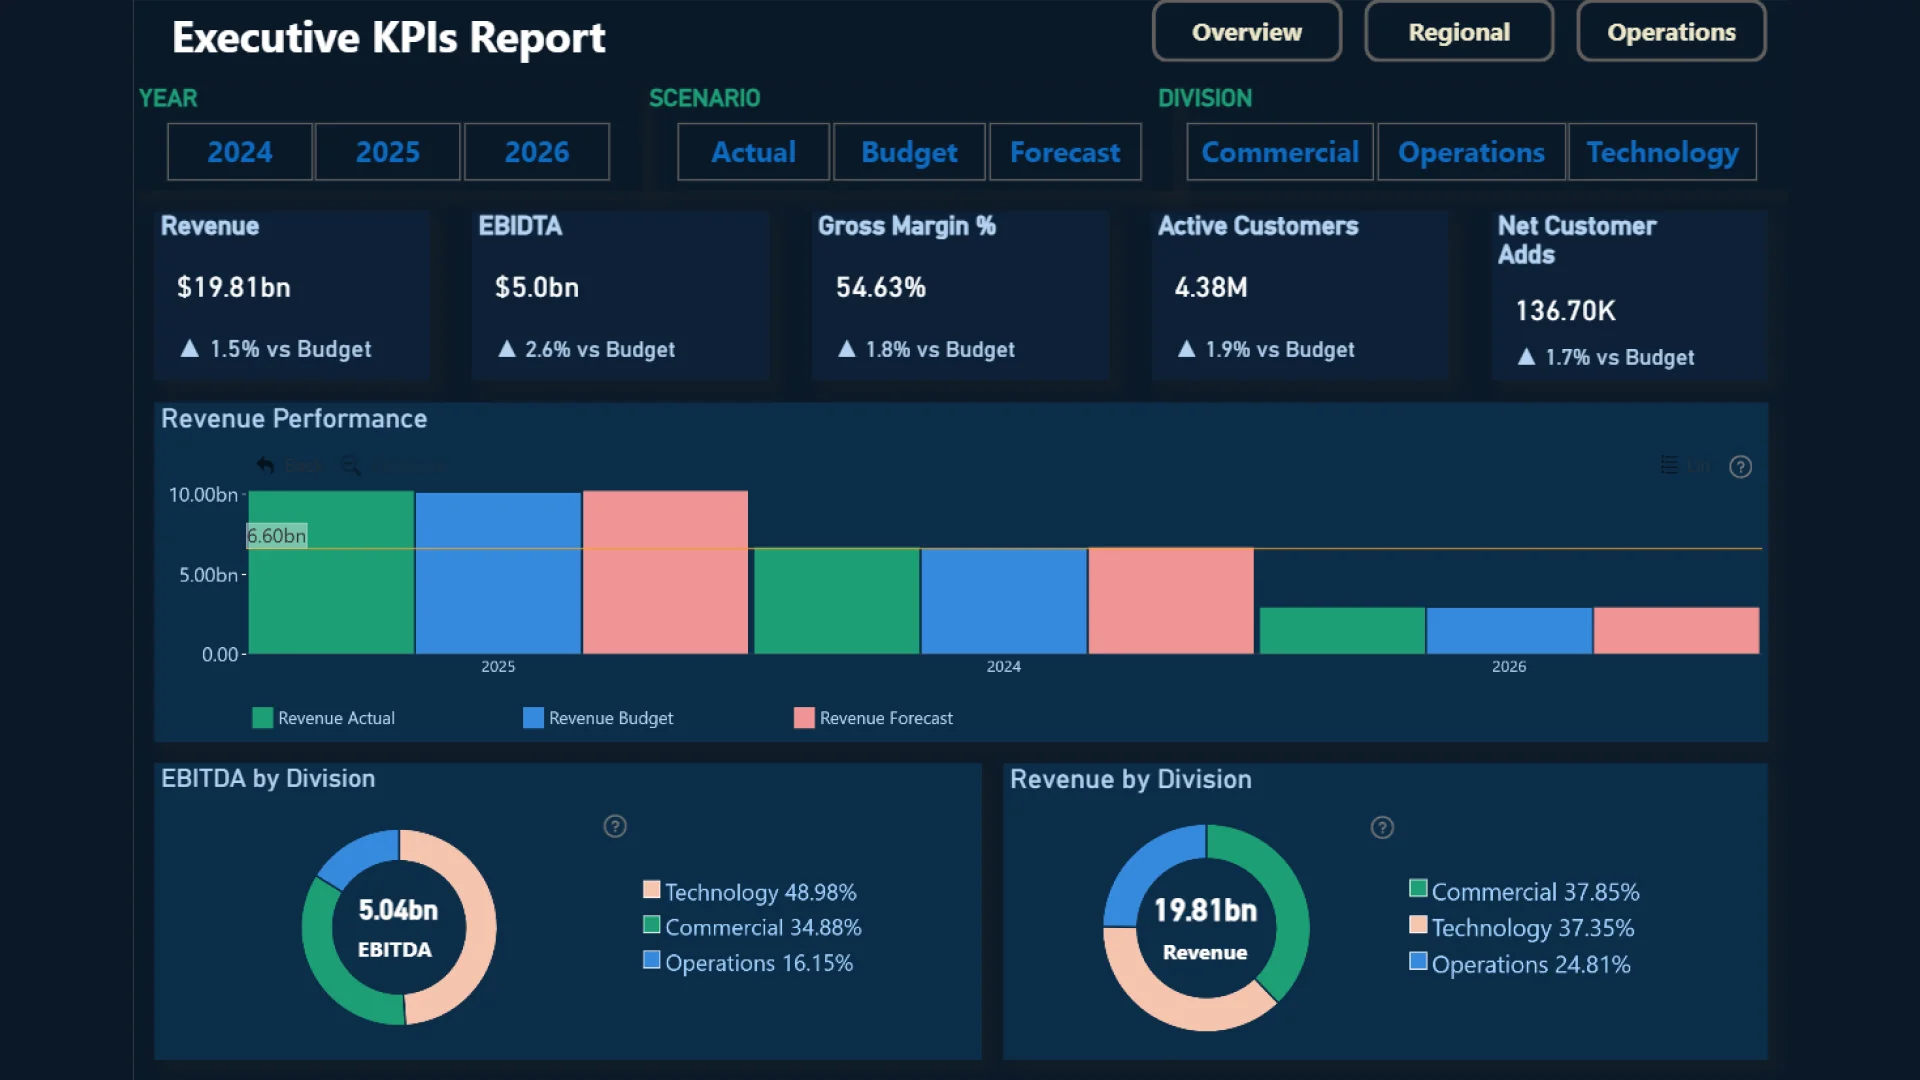
This 3-page Executive KPI Report provides a comprehensive view of organizational performance across Finance, Regional, and Operational dimensions.
Page 1 - Executive Overview: Tracks Revenue, EBITDA, Gross Margin, Active Customers, and Net Customer Adds with budget variance indicators.
Page 2 - Regional Performance: Analyzes revenue across EMEA, APAC, and AMER regions with country-level and market-tier breakdowns.
Page 3 - Operational KPIs: Monitors On-Time Delivery, Uptime, Support Tickets, and Cycle Time, with division-level drill-down enabled by ZoomCharts visuals.
Built with DAX variance measures, dynamic slicers, and button-based navigation to deliver an intuitive executive experience.
ZoomCharts visuals used
Mobile view allows you to interact with the report. To Download the template please switch to desktop view.